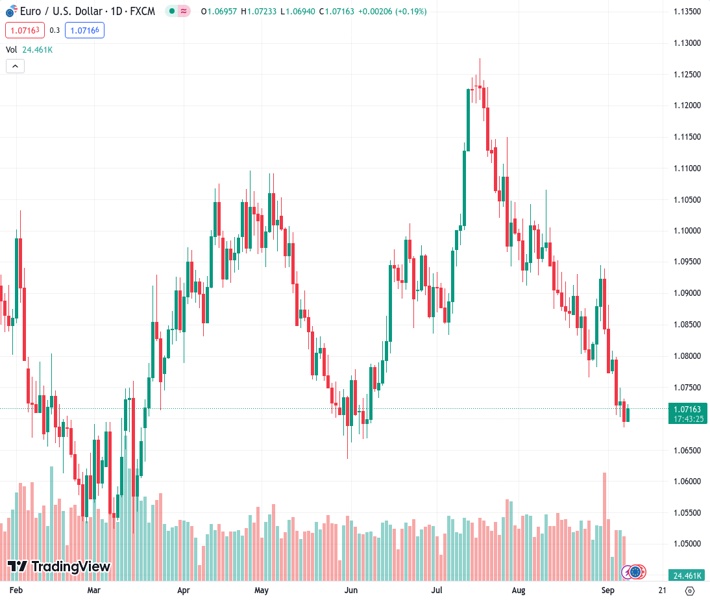
The EURUSD currency pair, currently at 1.07067, experiences a slight improvement after reaching a low point that was last seen three months ago on Thursday.
…
This is a premium post.
[s2If !current_user_can(access_s2member_level4)]Please register for FREE REGISTER to read full post below containing analysis. In case of any error or you think you are not able to read the full post below, please email us at support#nehcap.com [lwa][/s2If] [s2If current_user_can(access_s2member_level1)]
- EUR/USD stages a modest recovery from a three-month trough touched on Thursday.
The pair currently trades last at 1.07067.
The previous day high was 1.0732 while the previous day low was 1.0686. The daily 38.2% Fib levels comes at 1.0704, expected to provide support. Similarly, the daily 61.8% fib level is at 1.0714, expected to provide resistance.
The EUR/USD pair attracts some buying during the Asian session on Friday and reverses a major part of the previous day’s slide to the 1.0685 region, or a three-month low. Spot prices currently trade around the 1.0720 region, up nearly 0.20% for the day, and draw support from a modest US Dollar (USD) weakness, though any meaningful appreciating move still seems elusive.
The USD Index (DXY), which tracks the Greenback against a basket of currencies, pulls back from its highest level since March 9 as bulls opt to take some profits off the table ahead of China inflation data and the G20 leaders summit over the weekend. Apart from this, retreating US Treasury bond yields, along with signs of stability in the equity markets, undermine the safe-haven buck, which, in turn, is seen as a key factor acting as a tailwind for the EUR/USD pair. That said, the prospects for further policy tightening by the Federal Reserve (Fed) should limit any meaningful downside for the US bond yields and the USD.
In fact, the markets have been pricing in the possibility of one more 25 bps lift-off by the end of this year and expect the Fed to keep interest rates higher for longer. The bets were reaffirmed by Thursday’s release of the US Weekly Initial Jobless Claims, which fell more-than-expected, to 216K last week from the 228K previous. This comes on top of the upbeat US ISM Services PMI and adds to the narrative of a resilient US economy. This should allow the Fed to stick to its hawkish stance. In contrast, European Central Bank (ECB) officials have failed to provide a clear signal about the future rate hike path.
It is worth recalling that Slovak policymaker Peter Kazimir on Wednesday backed the case for one more rate hike in September, saying that it was necessary since inflation remained stubbornly high and expectations were too far above the ECB’s 2% target. Bank of Italy’s Governor and ECB Governing Council member Ignazio Visco, on the other hand, said that the ECB has nearly reached the level at which it will have to stop rate hikes. This, in turn, might hold back traders from placing aggressive bullish bets around the shared currency and keep a lid on any meaningful upside for the EUR/USD pair.
Traders now look to the release of the final German CPI print and French Industrial Production data for some impetus. Meanwhile, there isn’t any relevant market-moving economic data due for release from the US, leaving the USD at the mercy of the US bond yields and the broader risk sentiment. Nevertheless, the EUR/USD pair remains on track to register losses for the eighth straight week and the aforementioned fundamental backdrop suggests that the path of least resistance remains down. Hence, any subsequent move-up might still get sold into and seems limited ahead of the crucial ECB meeting next week.
Technical Levels: Supports and Resistances
EURUSD currently trading at 1.0719 at the time of writing. Pair opened at 1.0696 and is trading with a change of 0.22 % .
| Overview | Overview.1 | |
|---|---|---|
| 0 | Today last price | 1.0719 |
| 1 | Today Daily Change | 0.0023 |
| 2 | Today Daily Change % | 0.2200 |
| 3 | Today daily open | 1.0696 |
The pair remains strongly bearish on the daily time frame. It trades below the 20 SMA @ 1.0839, 50 SMA 1.0954, 100 SMA @ 1.0913 and 200 SMA @ 1.0823.
| Trends | Trends.1 | |
|---|---|---|
| 0 | Daily SMA20 | 1.0839 |
| 1 | Daily SMA50 | 1.0954 |
| 2 | Daily SMA100 | 1.0913 |
| 3 | Daily SMA200 | 1.0823 |
The previous day high was 1.0732 while the previous day low was 1.0686. The daily 38.2% Fib levels comes at 1.0704, expected to provide support. Similarly, the daily 61.8% fib level is at 1.0714, expected to provide resistance.
Note the levels of interest below:
- Pivot support is noted at 1.0678, 1.0659, 1.0632
- Pivot resistance is noted at 1.0723, 1.0751, 1.0769
| Levels | Levels.1 |
|---|---|
| Previous Daily High | 1.0732 |
| Previous Daily Low | 1.0686 |
| Previous Weekly High | 1.0946 |
| Previous Weekly Low | 1.0772 |
| Previous Monthly High | 1.1065 |
| Previous Monthly Low | 1.0766 |
| Daily Fibonacci 38.2% | 1.0704 |
| Daily Fibonacci 61.8% | 1.0714 |
| Daily Pivot Point S1 | 1.0678 |
| Daily Pivot Point S2 | 1.0659 |
| Daily Pivot Point S3 | 1.0632 |
| Daily Pivot Point R1 | 1.0723 |
| Daily Pivot Point R2 | 1.0751 |
| Daily Pivot Point R3 | 1.0769 |
[/s2If]
Download Nehcap EAWe have two EAs that are operational on our LIVE accounts.
- EA-FIX: Check out the details here. Download EA-FIX . EA-FIX is a non-grid HFT scalper.
- EA-GROWTH: High quality low dd EA using trend grids. Download EA_GROWTHJoin Our Telegram Group


