The USD to MXN exchange rate decreased by 0.30% to 17.5300, following Mexico’s inflation rate drop to 4.64%. This met market predictions and indicated a slowdown in the country’s economy.
…
This is a premium post.
[s2If !current_user_can(access_s2member_level4)]Please register for FREE REGISTER to read full post below containing analysis. In case of any error or you think you are not able to read the full post below, please email us at support#nehcap.com [lwa][/s2If] [s2If current_user_can(access_s2member_level1)]
- USD/MXN drops 0.30% to 17.5300 as Mexico’s inflation falls to 4.64%, meeting market expectations and signaling a cooling economy.
The pair currently trades last at 17.5257.
The previous day high was 17.6772 while the previous day low was 17.3957. The daily 38.2% Fib levels comes at 17.5697, expected to provide resistance. Similarly, the daily 61.8% fib level is at 17.5032, expected to provide support.
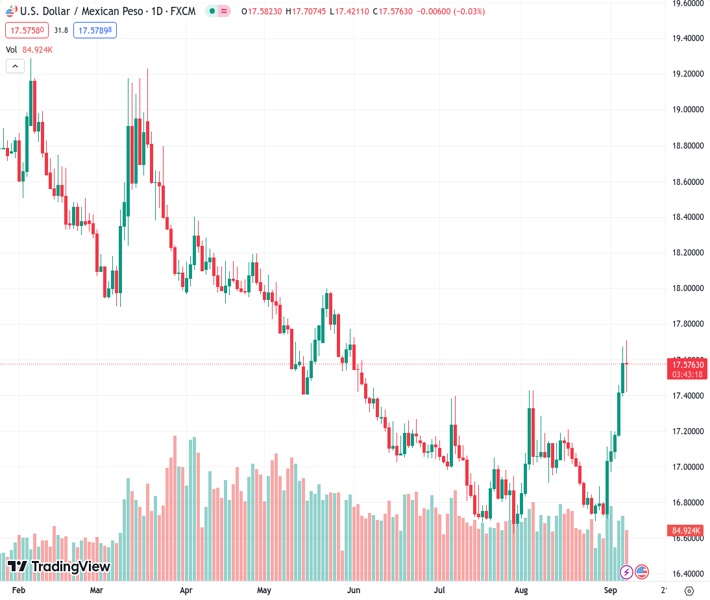
The Mexican Peso (MXN) recovered some ground against the US Dollar (USD) on Thursday, although Mexico’s economy deflates while the US jobs market remains tight. Hence, the USD/MXN is trading at 17.5300, a loss of 0.30%, after hitting a daily high of 17.7074.
The Instituto Nacional de Estadistica Geografia e Informatica (INEGI) revealed that inflation in Mexico dropped to its lowest level since March 2021, at 4.64%, as expected by market analysts. Core inflation, which excludes volatile items, slowed sharply to a 20-month low in August at 6.08%, below the foreseen 6.12%.
Jonathan Heath, a Deputy Governor of the Bank of Mexico (Banxico), said in social media X that core inflation was “good news” while adding, “There is still a long way to go.” Recently, some Banxico officials stressed the need to maintain higher rates as the central bank curbs inflation.
Across the border, the US Bureau of Labor Statistics (BLS) revealed that unemployment claims rose by 216K, beneath 229K forecasts on the week ending September 2, flashing a tight labor market. Even though the Greenback (USD) appreciated against most G8 currencies on the news release, the Mexican Peso outweighed the former, as the USD/MXN continued to trend downwards.
Fed officials have become more neutral, as data suggests prices are cooling down. But the resilience of the US jobs market puts the US central bank at a crossroads between doing too much and triggering a recession or perhaps under-tightening and suffering the consequences of an acceleration of inflation.
Meanwhile, the CME FedWatch Tool depicts money markets have fully priced in the Fed will keep rates unchanged in September. But for November, chances of a 25 bps increase lie at 43.5%.
Given the recent developments in both economies, the USD/MXN is set to print more gains, though it would face strong resistance at 18.0000. Any hawkish surprises by the Fed and next year’s Mexico general election could trigger outflows from the emerging market currency.
From a technical standpoint, the USD/MXN is neutral to upward biased. Still, today’s pause could spur some consolidation as bulls recharge batteries to challenge the 18.0000 psychological figure. Even though a pin-bar is forming, a daily close below September’s 6 low of 17.3912 could pave the way for a deeper correction. Otherwise, a break above 17.7074 and the pair could reach 18.0000.
Technical Levels: Supports and Resistances
USDMXN currently trading at 17.571 at the time of writing. Pair opened at 17.5758 and is trading with a change of -0.03 % .
| Overview | Overview.1 | |
|---|---|---|
| 0 | Today last price | 17.5710 |
| 1 | Today Daily Change | -0.0048 |
| 2 | Today Daily Change % | -0.0300 |
| 3 | Today daily open | 17.5758 |
The pair is trading above its 20 Daily moving average @ 17.0289, above its 50 Daily moving average @ 16.9892 , above its 100 Daily moving average @ 17.2853 and below its 200 Daily moving average @ 18.0364
| Trends | Trends.1 | |
|---|---|---|
| 0 | Daily SMA20 | 17.0289 |
| 1 | Daily SMA50 | 16.9892 |
| 2 | Daily SMA100 | 17.2853 |
| 3 | Daily SMA200 | 18.0364 |
The previous day high was 17.6772 while the previous day low was 17.3957. The daily 38.2% Fib levels comes at 17.5697, expected to provide resistance. Similarly, the daily 61.8% fib level is at 17.5032, expected to provide support.
Note the levels of interest below:
- Pivot support is noted at 17.4219, 17.2681, 17.1404
- Pivot resistance is noted at 17.7034, 17.8311, 17.9849
| Levels | Levels.1 |
|---|---|
| Previous Daily High | 17.6772 |
| Previous Daily Low | 17.3957 |
| Previous Weekly High | 17.2025 |
| Previous Weekly Low | 16.6945 |
| Previous Monthly High | 17.4274 |
| Previous Monthly Low | 16.6945 |
| Daily Fibonacci 38.2% | 17.5697 |
| Daily Fibonacci 61.8% | 17.5032 |
| Daily Pivot Point S1 | 17.4219 |
| Daily Pivot Point S2 | 17.2681 |
| Daily Pivot Point S3 | 17.1404 |
| Daily Pivot Point R1 | 17.7034 |
| Daily Pivot Point R2 | 17.8311 |
| Daily Pivot Point R3 | 17.9849 |
[/s2If]
Download Nehcap EAWe have two EAs that are operational on our LIVE accounts.
- EA-FIX: Check out the details here. Download EA-FIX . EA-FIX is a non-grid HFT scalper.
- EA-GROWTH: High quality low dd EA using trend grids. Download EA_GROWTHJoin Our Telegram Group


