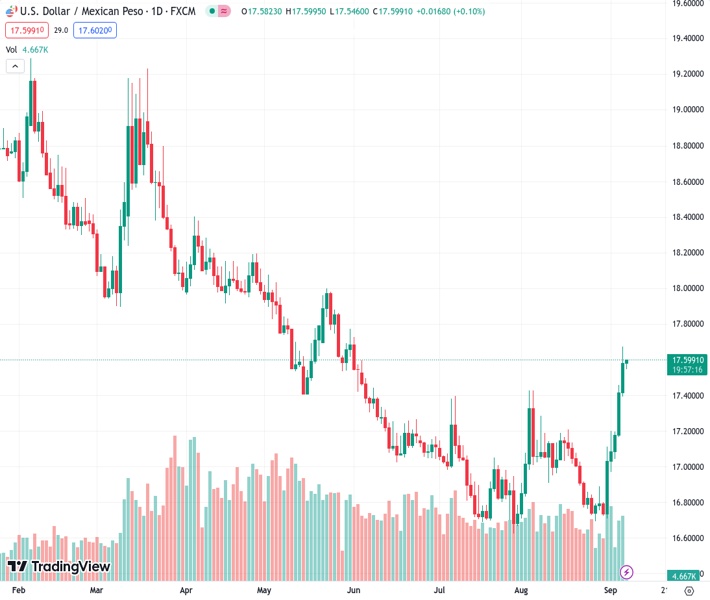
The US dollar to Mexican peso exchange rate, currently at 17.5981, continues to show strength and is at its highest level in three months. This is the case despite the lack of recent action, and the rate has increased for the sixth day in a row.
…
This is a premium post.
[s2If !current_user_can(access_s2member_level4)]Please register for FREE REGISTER to read full post below containing analysis. In case of any error or you think you are not able to read the full post below, please email us at support#nehcap.com [lwa][/s2If] [s2If current_user_can(access_s2member_level1)]
- USD/MXN remains firmer at the highest level in three months despite latest inaction, up for the sixth consecutive day.
The pair currently trades last at 17.5981.
The previous day high was 17.6772 while the previous day low was 17.3957. The daily 38.2% Fib levels comes at 17.5697, expected to provide support. Similarly, the daily 61.8% fib level is at 17.5032, expected to provide support.
USD/MXN remains on the front foot for the sixth consecutive day despite making rounds to a three-month high marked the previous day during the early hours of Thursday’s Asian session. That said, the Mexican Peso (MXN) pair prints mild gains around 17.60 by the press time, picking up bids of late to reverse the late Wednesday’s retreat from the multi-day high of 17.67.
Broad US Dollar strength amid optimism about the US economy, contrasts with the fears of recession elsewhere, and joins the Federal Reserve signals to defend the USD/MXN bulls even as the Peso has the higher yields.
The US Dollar Index (DXY) rose to a fresh high since March 15 on Wednesday while flashing a figure close to the 105.00 threshold before retreating to 104.85 afterward, around 104.90 by the press time. Even so, the Greenback’s gauge versus the six major currencies remains on the way to posting an eighth consecutive weekly gain amid economic optimism.
That said, the US ISM Services PMI rose to a six-month high of 54.5 in August versus 52.5 expected and 52.7 prior. Further, the final readings of the S&P Global Composite and Services PMIs eased to 50.2 and 50.5 for the said month compared to the initial estimations of 50.4 and 51.0 in that order. It should be noted that all three major constituents of the ISM Services PMI, namely Employment, New Orders and Prices Paid rose notably beyond the previous readings and helped the US Dollar to reverse early-day pullback. Earlier in the week, the US Factory Orders for July dropped to the lowest since mid-2020 but the details about the orders excluding transport, shipments of goods and inventories were impressive to defend the hawkish Fed bias.
Given the mostly upbeat US data, Federal Reserve (Fed) Governor Christopher Waller defended hawkish monetary policy during a CNBC interview while Cleveland Federal Reserve President Loretta Mester ruled out rate cuts. However, Federal Reserve Bank of Boston President Susan Collins cited the risk of an overly restrictive stance on monetary policy to suggest the need for a patient and careful, but deliberate, approach. It should be noted, however, that the Fed’s Beige Book pushed back expectations of witnessing either a policy pivot or rate cut from the Fed while stating, “US economic growth was modest amid a cooling labor market and slowing inflation pressures in July and August,” which in turn fuels the yields and the US Dollar.
Additionally fueling the US Dollar, as well as the USD/MXN pair could be the downbeat concerns about China, the world’s second-largest economy. That said, China’s Caixin Services PMI joined the market’s lack of confidence in the Dragon Nation’s stimulus to spoil the concerns about Beijing. On the same line could be the US-China tension surrounding the trade conditions and Taiwan.
Against this backdrop, S&P 500 Futures remain depressed after Wall Street benchmarks closed in the red for the second consecutive day. That said, the US 10-year Treasury bond yields rose to a two-week high of around 4.30% and the two-year refreshed weekly top above 5.0%, which in turn offered notable strength to the US Dollar.
Moving on, Mexico’s Headline Inflation, 12-month Inflation and Core Inflation details for August will precede the weekly US Initial Jobless Claims and the quarterly readings of Nonfarm Productivity, as well as the Unit Labor Costs for the second quarter (Q2), to decorate the calendar and should be watched carefully for clear directions.
A daily closing beyond the 17.42-43 horizontal resistance, now support, keeps the USD/MXN buyers hopeful of approaching the 18.00 threshold.
Technical Levels: Supports and Resistances
USDMXN currently trading at 17.5947 at the time of writing. Pair opened at 17.5758 and is trading with a change of 0.11% % .
| Overview | Overview.1 | |
|---|---|---|
| 0 | Today last price | 17.5947 |
| 1 | Today Daily Change | 0.0189 |
| 2 | Today Daily Change % | 0.11% |
| 3 | Today daily open | 17.5758 |
The pair is trading above its 20 Daily moving average @ 17.0289, above its 50 Daily moving average @ 16.9892 , above its 100 Daily moving average @ 17.2853 and below its 200 Daily moving average @ 18.0364
| Trends | Trends.1 | |
|---|---|---|
| 0 | Daily SMA20 | 17.0289 |
| 1 | Daily SMA50 | 16.9892 |
| 2 | Daily SMA100 | 17.2853 |
| 3 | Daily SMA200 | 18.0364 |
The previous day high was 17.6772 while the previous day low was 17.3957. The daily 38.2% Fib levels comes at 17.5697, expected to provide support. Similarly, the daily 61.8% fib level is at 17.5032, expected to provide support.
Note the levels of interest below:
- Pivot support is noted at 17.4219, 17.2681, 17.1404
- Pivot resistance is noted at 17.7034, 17.8311, 17.9849
| Levels | Levels.1 |
|---|---|
| Previous Daily High | 17.6772 |
| Previous Daily Low | 17.3957 |
| Previous Weekly High | 17.2025 |
| Previous Weekly Low | 16.6945 |
| Previous Monthly High | 17.4274 |
| Previous Monthly Low | 16.6945 |
| Daily Fibonacci 38.2% | 17.5697 |
| Daily Fibonacci 61.8% | 17.5032 |
| Daily Pivot Point S1 | 17.4219 |
| Daily Pivot Point S2 | 17.2681 |
| Daily Pivot Point S3 | 17.1404 |
| Daily Pivot Point R1 | 17.7034 |
| Daily Pivot Point R2 | 17.8311 |
| Daily Pivot Point R3 | 17.9849 |
[/s2If]
Download Nehcap EAWe have two EAs that are operational on our LIVE accounts.
- EA-FIX: Check out the details here. Download EA-FIX . EA-FIX is a non-grid HFT scalper.
- EA-GROWTH: High quality low dd EA using trend grids. Download EA_GROWTHJoin Our Telegram Group


