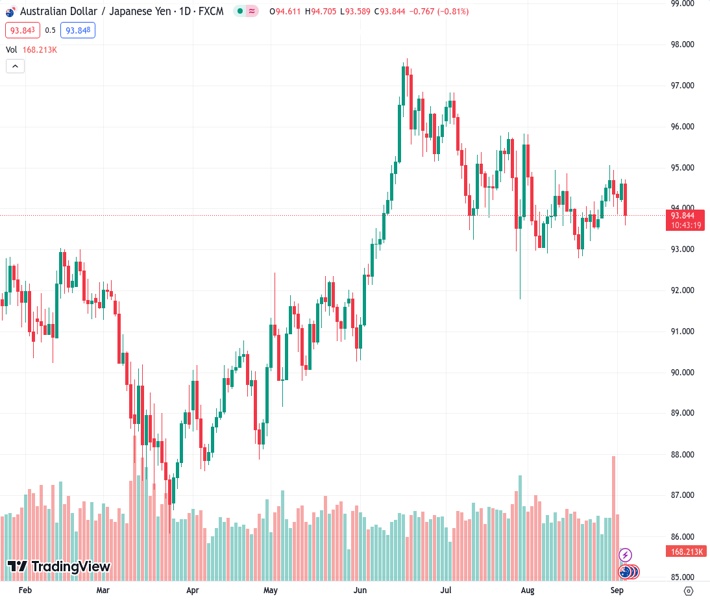
The AUDJPY currency pair rapidly declined after the Reserve Bank of Australia (RBA) proclaimed an unchanging interest rate.
…
This is a premium post.
[s2If !current_user_can(access_s2member_level4)]Please register for FREE REGISTER to read full post below containing analysis. In case of any error or you think you are not able to read the full post below, please email us at support#nehcap.com [lwa][/s2If] [s2If current_user_can(access_s2member_level1)]
- AUD/JPY dropped vertically after the RBA announced a steady interest rate decision.
The pair currently trades last at 93.8240.
The previous day high was 94.72 while the previous day low was 94.2. The daily 38.2% Fib levels comes at 94.52, expected to provide resistance. Similarly, the daily 61.8% fib level is at 94.4, expected to provide resistance.
The AUD/JPY pair finds an intermediate cushion near 93.60 after a vertical fall inspired by the steady interest rate decision from the Reserve Bank of Australia (RBA). The RBA kept the Official Cash Rate (OCR) unchanged at 4.10% but warned that some further tightening of monetary policy may be required as inflation is still too high and will remain so for some time yet.
Market participants expect that the RBA is done with hiking interest rates as uncertainty over the Chinese economic outlook increases due to faltering prospects.
Meanwhile, the Japanese Yen remains on tenterhooks as investors await the April-June quarter report. As per the estimates, the Japanese economy grew by 1.3%, slower than the growth rate of 1.5% reported for Q1.
AUD/JPY delivers a breakdown of the Ascending Triangle chart pattern formed on a four-hour scale, which opens the door for a fresh downside. For the time being, the asset is expected to remain well-supported above the horizontal support plotted from July 21 low at $91.79. The 20-period Exponential Moving Average (EMA) at $94.30 continues to act as a barricade for the Australian Dollar bulls.
The Relative Strength Index (RSI) (14) skis into the bearish range of 20.00-40.00, which indicates that the bearish momentum has been activated.
Further downside below August 14 low at $93.57 would expose the asset to August 18 low at $92.79 followed by July 21 low at $91.79.
In an alternate scenario, a recovery move above the previous week’s high at $95.00 will drive the asset toward July 25 high at $95.86. Breach of the latter would further drive the asset towards July 4 high at $96.83.
Technical Levels: Supports and Resistances
AUDJPY currently trading at 93.87 at the time of writing. Pair opened at 94.65 and is trading with a change of -0.82 % .
| Overview | Overview.1 | |
|---|---|---|
| 0 | Today last price | 93.87 |
| 1 | Today Daily Change | -0.78 |
| 2 | Today Daily Change % | -0.82 |
| 3 | Today daily open | 94.65 |
The pair is trading below its 20 Daily moving average @ 94.03, below its 50 Daily moving average @ 94.56 , above its 100 Daily moving average @ 93.37 and above its 200 Daily moving average @ 91.93
| Trends | Trends.1 | |
|---|---|---|
| 0 | Daily SMA20 | 94.03 |
| 1 | Daily SMA50 | 94.56 |
| 2 | Daily SMA100 | 93.37 |
| 3 | Daily SMA200 | 91.93 |
The previous day high was 94.72 while the previous day low was 94.2. The daily 38.2% Fib levels comes at 94.52, expected to provide resistance. Similarly, the daily 61.8% fib level is at 94.4, expected to provide resistance.
Note the levels of interest below:
- Pivot support is noted at 94.32, 94.0, 93.8
- Pivot resistance is noted at 94.85, 95.05, 95.37
| Levels | Levels.1 |
|---|---|
| Previous Daily High | 94.72 |
| Previous Daily Low | 94.20 |
| Previous Weekly High | 95.06 |
| Previous Weekly Low | 93.78 |
| Previous Monthly High | 95.81 |
| Previous Monthly Low | 92.79 |
| Daily Fibonacci 38.2% | 94.52 |
| Daily Fibonacci 61.8% | 94.40 |
| Daily Pivot Point S1 | 94.32 |
| Daily Pivot Point S2 | 94.00 |
| Daily Pivot Point S3 | 93.80 |
| Daily Pivot Point R1 | 94.85 |
| Daily Pivot Point R2 | 95.05 |
| Daily Pivot Point R3 | 95.37 |
[/s2If]
Download Nehcap EAWe have two EAs that are operational on our LIVE accounts.
- EA-FIX: Check out the details here. Download EA-FIX . EA-FIX is a non-grid HFT scalper.
- EA-GROWTH: High quality low dd EA using trend grids. Download EA_GROWTHJoin Our Telegram Group


