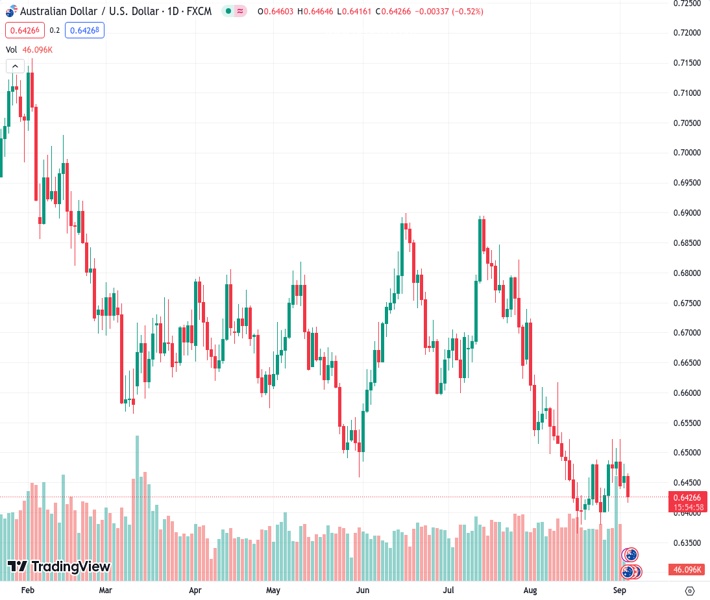
AUDUSD at 0.64266 faces new selling pressure and is burdened by various factors.
…
This is a premium post.
[s2If !current_user_can(access_s2member_level4)]Please register for FREE REGISTER to read full post below containing analysis. In case of any error or you think you are not able to read the full post below, please email us at support#nehcap.com [lwa][/s2If] [s2If current_user_can(access_s2member_level1)]
- AUD/USD comes under fresh selling pressure and is weighed down by a combination of factors.
The pair currently trades last at 0.64266.
The previous day high was 0.648 while the previous day low was 0.6445. The daily 38.2% Fib levels comes at 0.6467, expected to provide resistance. Similarly, the daily 61.8% fib level is at 0.6458, expected to provide resistance.
The AUD/USD pair struggles to capitalize on the previous day’s modest gains and meets with a fresh supply during the Asian session on Tuesday. Spot prices remain depressed near the 0.6430-0.6420 region, or a one-week low and move little after the Reserve Bank of Australia (RBA) announced its policy decision.
As was widely anticipated, the RBA decided to leave the Official Cash Rate (OCR) unchanged at 4.10% for the third time in a row at the end of the September meeting. In the accompanying policy statement, the central bank said that the on-hold decision provides further time to assess the impact of the increase in interest rates to date and the economic outlook. This, along with the weaker Chinese PMI, undermines the Australian Dollar (AUD). Apart from this, the emergence of some US Dollar (USD) buying contributes to the offered tone surrounding the AUD/USD pair.
In fact, the USD Index (DXY), which tracks the Greenback against a basket of currencies, stands tall just below a nearly three-month peak touched in August and remains well supported by expectations that the Federal Reserve (Fed) will keep rates higher for longer. Despite signs that labour market conditions in the US were easing, the markets are still pricing in the possibility of one more 25 bps lift-off by the end of this year. This, in turn, remains supportive of elevated US Treasury bond yields, which lends support to the buck and weighs on the AUD/USD pair.
The aforementioned fundamental backdrop favours bearish traders and suggests that the path of least resistance for spot prices is to the downside. Hence, a subsequent fall back towards challenging the YTD low, around the 0.6365 region touched on August 17, looks like a distinct possibility. Some follow-through selling will be seen as a fresh trigger for bearish traders and pave the way for an extension of the AUD/USD pair’s well-established downtrend witnessed since July 14, from the vicinity of the 0.6900 mark, which constituted the bearish double-top on the daily chart.
Technical Levels: Supports and Resistances
AUDUSD currently trading at 0.6426 at the time of writing. Pair opened at 0.6462 and is trading with a change of -0.56 % .
| Overview | Overview.1 | |
|---|---|---|
| 0 | Today last price | 0.6426 |
| 1 | Today Daily Change | -0.0036 |
| 2 | Today Daily Change % | -0.5600 |
| 3 | Today daily open | 0.6462 |
The pair remains strongly bearish on the daily time frame. It trades below the 20 SMA @ 0.6459, 50 SMA 0.6602, 100 SMA @ 0.6641 and 200 SMA @ 0.672.
| Trends | Trends.1 | |
|---|---|---|
| 0 | Daily SMA20 | 0.6459 |
| 1 | Daily SMA50 | 0.6602 |
| 2 | Daily SMA100 | 0.6641 |
| 3 | Daily SMA200 | 0.6720 |
The previous day high was 0.648 while the previous day low was 0.6445. The daily 38.2% Fib levels comes at 0.6467, expected to provide resistance. Similarly, the daily 61.8% fib level is at 0.6458, expected to provide resistance.
Note the levels of interest below:
- Pivot support is noted at 0.6444, 0.6427, 0.6409
- Pivot resistance is noted at 0.648, 0.6498, 0.6515
| Levels | Levels.1 |
|---|---|
| Previous Daily High | 0.6480 |
| Previous Daily Low | 0.6445 |
| Previous Weekly High | 0.6522 |
| Previous Weekly Low | 0.6401 |
| Previous Monthly High | 0.6724 |
| Previous Monthly Low | 0.6364 |
| Daily Fibonacci 38.2% | 0.6467 |
| Daily Fibonacci 61.8% | 0.6458 |
| Daily Pivot Point S1 | 0.6444 |
| Daily Pivot Point S2 | 0.6427 |
| Daily Pivot Point S3 | 0.6409 |
| Daily Pivot Point R1 | 0.6480 |
| Daily Pivot Point R2 | 0.6498 |
| Daily Pivot Point R3 | 0.6515 |
[/s2If]
Download Nehcap EAWe have two EAs that are operational on our LIVE accounts.
- EA-FIX: Check out the details here. Download EA-FIX . EA-FIX is a non-grid HFT scalper.
- EA-GROWTH: High quality low dd EA using trend grids. Download EA_GROWTHJoin Our Telegram Group


