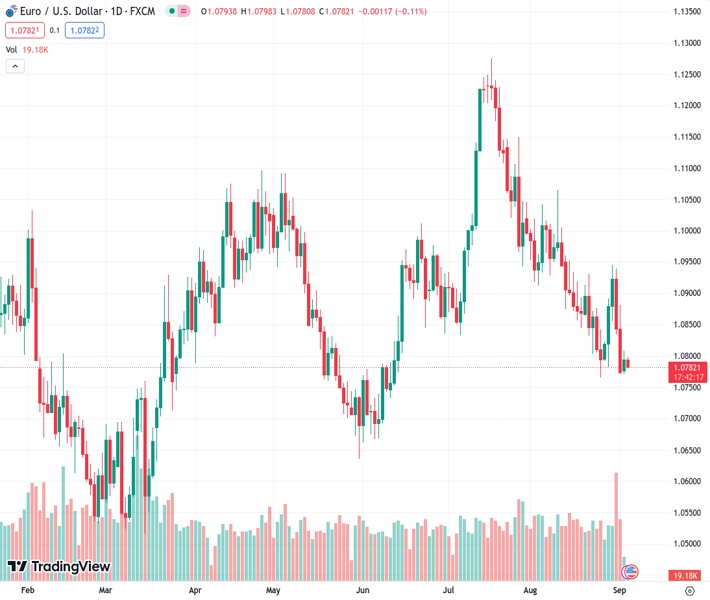
On Tuesday, the EUR/USD pair encountered new selling pressure at a rate of 1.07813 due to a slight increase in the value of the USD.
…
This is a premium post.
[s2If !current_user_can(access_s2member_level4)]Please register for FREE REGISTER to read full post below containing analysis. In case of any error or you think you are not able to read the full post below, please email us at support#nehcap.com [lwa][/s2If] [s2If current_user_can(access_s2member_level1)]
- EUR/USD meets with fresh supply on Tuesday and is weighed down by a modest USD uptick.
The pair currently trades last at 1.07813.
The previous day high was 1.0809 while the previous day low was 1.0772. The daily 38.2% Fib levels comes at 1.0795, expected to provide resistance. Similarly, the daily 61.8% fib level is at 1.0786, expected to provide resistance.
The EUR/USD pair struggles to capitalize on the previous day’s modest gains and attracts fresh sellers in the vicinity of the 1.0800 round-figure mark during the Asian session on Tuesday. Spot prices, meanwhile, remain well within the striking distance of over a two-month low, around the 1.0765 region touched in July and seem vulnerable below a technically significant 200-day Simple Moving Average (SMA).
The negative outlook for the EUR/USD pair is reinforced by the fact that oscillators on the daily chart are holding deep in the bearish territory and are still far from being in the oversold zone. Apart from this, the emergence of some US Dollar (USD) buying suggests that the path of least resistance for spot prices is to the downside. Hence, a subsequent slide to the 1.0765 region, en route to the 1.0700 mark, looks like a distinct possibility.
The next relevant support is pegged near the May monthly swing low, around the 1.0635 region. This is followed by the 1.0600 round figure, which if broken decisively will be seen as a fresh trigger for bearish traders and pave the way for deeper losses. The EUR/USD pair might then turn vulnerable and accelerate the fall towards the 1.0530-1.0525 intermediate support before eventually dropping to the 1.0500 psychological mark.
On the flip side, recovery above the 1.0800 level is likely to confront stiff resistance near the 200-day SMA, currently around the 1.0815-1.0820 region. A sustained strength beyond might trigger a short-covering rally and allow the EUR/USD pair to reclaim the 1.0900 round-figure mark. Any subsequent move up, however, might still be seen as a selling opportunity and remain capped near last week’s swing high, around the 1.0840-1.0845 zone.
The latter should act as a pivotal point for the EUR/USD pair, which if cleared decisively will suggest that the recent sharp pullback from the 1.1275 region, or a 17-month peak touched in July has run its course. This, in turn, will set the stage for some meaningful near-term appreciating move.
Technical Levels: Supports and Resistances
EURUSD currently trading at 1.0784 at the time of writing. Pair opened at 1.0795 and is trading with a change of -0.1 % .
| Overview | Overview.1 | |
|---|---|---|
| 0 | Today last price | 1.0784 |
| 1 | Today Daily Change | -0.0011 |
| 2 | Today Daily Change % | -0.1000 |
| 3 | Today daily open | 1.0795 |
The pair remains strongly bearish on the daily time frame. It trades below the 20 SMA @ 1.0877, 50 SMA 1.0966, 100 SMA @ 1.0921 and 200 SMA @ 1.0818.
| Trends | Trends.1 | |
|---|---|---|
| 0 | Daily SMA20 | 1.0877 |
| 1 | Daily SMA50 | 1.0966 |
| 2 | Daily SMA100 | 1.0921 |
| 3 | Daily SMA200 | 1.0818 |
The previous day high was 1.0809 while the previous day low was 1.0772. The daily 38.2% Fib levels comes at 1.0795, expected to provide resistance. Similarly, the daily 61.8% fib level is at 1.0786, expected to provide resistance.
Note the levels of interest below:
- Pivot support is noted at 1.0775, 1.0755, 1.0738
- Pivot resistance is noted at 1.0812, 1.0829, 1.0849
| Levels | Levels.1 |
|---|---|
| Previous Daily High | 1.0809 |
| Previous Daily Low | 1.0772 |
| Previous Weekly High | 1.0946 |
| Previous Weekly Low | 1.0772 |
| Previous Monthly High | 1.1065 |
| Previous Monthly Low | 1.0766 |
| Daily Fibonacci 38.2% | 1.0795 |
| Daily Fibonacci 61.8% | 1.0786 |
| Daily Pivot Point S1 | 1.0775 |
| Daily Pivot Point S2 | 1.0755 |
| Daily Pivot Point S3 | 1.0738 |
| Daily Pivot Point R1 | 1.0812 |
| Daily Pivot Point R2 | 1.0829 |
| Daily Pivot Point R3 | 1.0849 |
[/s2If]
Download Nehcap EAWe have two EAs that are operational on our LIVE accounts.
- EA-FIX: Check out the details here. Download EA-FIX . EA-FIX is a non-grid HFT scalper.
- EA-GROWTH: High quality low dd EA using trend grids. Download EA_GROWTHJoin Our Telegram Group


