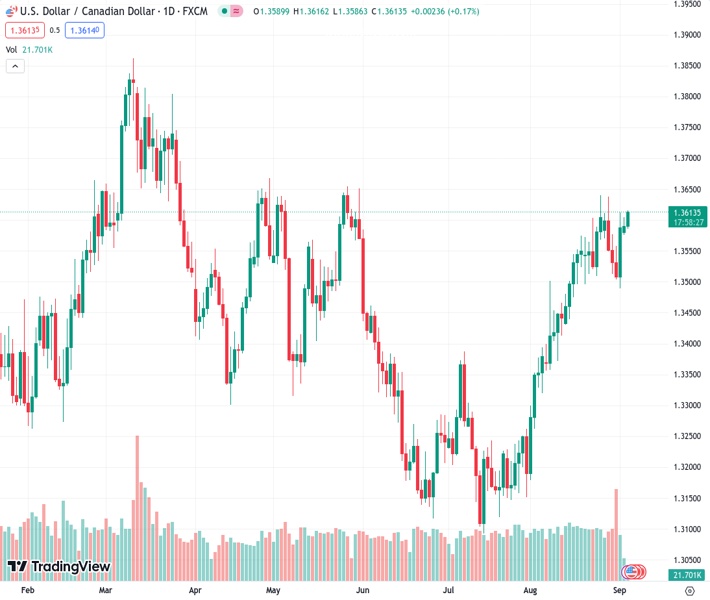
The USDCAD currency pair is experiencing buying interest, causing it to reverse its decline at the beginning of the week. It is now testing a resistance level that has been forming since late April. The Nehcap view suggests that a slight downward correction is anticipated.
…
This is a premium post.
[s2If !current_user_can(access_s2member_level4)]Please register for FREE REGISTER to read full post below containing analysis. In case of any error or you think you are not able to read the full post below, please email us at support#nehcap.com [lwa][/s2If] [s2If current_user_can(access_s2member_level1)]
- USD/CAD picks up bids to reverse the week-start retreat, poking downward-sloping resistance line from late April at the latest.
The pair currently trades last at 1.36131.
The previous day high was 1.3605 while the previous day low was 1.3576. The daily 38.2% Fib levels comes at 1.3587, expected to provide support. Similarly, the daily 61.8% fib level is at 1.3593, expected to provide support.
USD/CAD pierces the 1.3600 threshold as buyers attack a downward-sloping resistance line from late April amid the very early Tuesday morning in Europe.
Also read: USD/CAD trades sideways below the 1.3600 mark, BoC rate decision, US Services PMI eyed
The Loonie pair justified overbought conditions of the RSI (14) line to retreat the previous day. Even so, the quote stayed beyond the 61.8% Fibonacci retracement of the March–July downside, not to mention its defense of the recovery from the 21-DMA.
Also keeping the USD/CAD buyers hopeful is the early-August run-up beyond the six-month-old previous resistance line.
Hence, the quote stays on the bull’s radar but the further upside appears limited, which in turn highlights the immediate resistance line surrounding 1.3610.
Following that, the previous monthly high of 1.3640 will precede the tops marked in May and April, respectively near 1.3655 and 1.3670, to challenge the USD/CAD buyers.
In a case where the Loonie pair buyers keep the reins past 1.3670, the odds of witnessing its gradual rise toward March’s peak of 1.3861 can’t be ruled out.
On the contrary, a daily closing beneath the 61.8% Fibonacci ratio and the 21-DMA, respectively near 1.3570 and 1.3530, becomes necessary to recall the USD/CAD bears.
In those conditions, the 50% Fibonacci retracement level of .3480 could lure the USD/CAD sellers before challenging them with the 1.3400 support confluence comprising the 100-DMA and previous resistance line stretched from early March.
Trend: Pullback expected
Technical Levels: Supports and Resistances
USDCAD currently trading at 1.3607 at the time of writing. Pair opened at 1.3591 and is trading with a change of 0.12% % .
| Overview | Overview.1 | |
|---|---|---|
| 0 | Today last price | 1.3607 |
| 1 | Today Daily Change | 0.0016 |
| 2 | Today Daily Change % | 0.12% |
| 3 | Today daily open | 1.3591 |
The pair remains strongly bullish on the daily timeframe. It trades above its 20 SMA @ 1.3525, 50 SMA 1.3355, 100 SMA @ 1.3398 and 200 SMA @ 1.3464.
| Trends | Trends.1 | |
|---|---|---|
| 0 | Daily SMA20 | 1.3525 |
| 1 | Daily SMA50 | 1.3355 |
| 2 | Daily SMA100 | 1.3398 |
| 3 | Daily SMA200 | 1.3464 |
The previous day high was 1.3605 while the previous day low was 1.3576. The daily 38.2% Fib levels comes at 1.3587, expected to provide support. Similarly, the daily 61.8% fib level is at 1.3593, expected to provide support.
Note the levels of interest below:
- Pivot support is noted at 1.3576, 1.3561, 1.3547
- Pivot resistance is noted at 1.3605, 1.362, 1.3634
| Levels | Levels.1 |
|---|---|
| Previous Daily High | 1.3605 |
| Previous Daily Low | 1.3576 |
| Previous Weekly High | 1.3637 |
| Previous Weekly Low | 1.3489 |
| Previous Monthly High | 1.3640 |
| Previous Monthly Low | 1.3184 |
| Daily Fibonacci 38.2% | 1.3587 |
| Daily Fibonacci 61.8% | 1.3593 |
| Daily Pivot Point S1 | 1.3576 |
| Daily Pivot Point S2 | 1.3561 |
| Daily Pivot Point S3 | 1.3547 |
| Daily Pivot Point R1 | 1.3605 |
| Daily Pivot Point R2 | 1.3620 |
| Daily Pivot Point R3 | 1.3634 |
[/s2If]
Download Nehcap EAWe have two EAs that are operational on our LIVE accounts.
- EA-FIX: Check out the details here. Download EA-FIX . EA-FIX is a non-grid HFT scalper.
- EA-GROWTH: High quality low dd EA using trend grids. Download EA_GROWTHJoin Our Telegram Group


