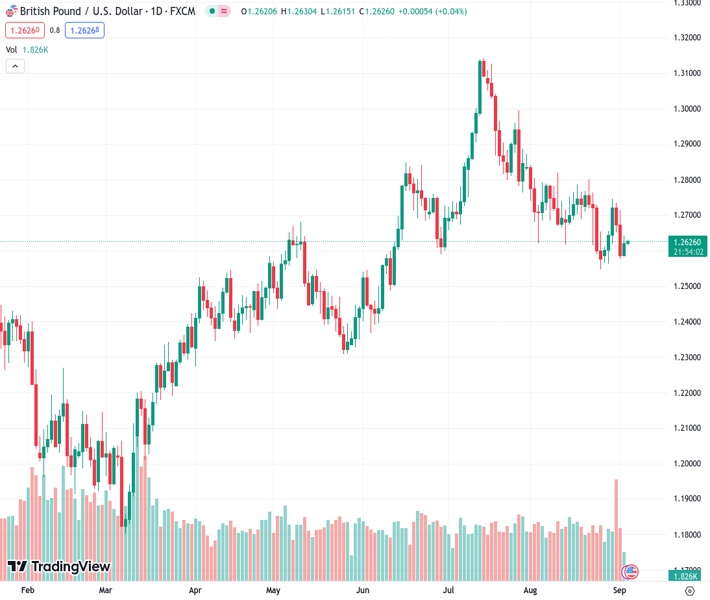
The GBP/USD currency pair has slightly increased in value to 1.26268 after ending a two-day period of losses. However, there is not anticipated to be a significant increase in value moving forward, according to the opinion of Nehcap.
…
This is a premium post.
[s2If !current_user_can(access_s2member_level4)]Please register for FREE REGISTER to read full post below containing analysis. In case of any error or you think you are not able to read the full post below, please email us at support#nehcap.com [lwa][/s2If] [s2If current_user_can(access_s2member_level1)]
- GBP/USD edges higher after snapping two-day losing streak the previous day.
The pair currently trades last at 1.26268.
The previous day high was 1.2713 while the previous day low was 1.2578. The daily 38.2% Fib levels comes at 1.2629, expected to provide resistance. Similarly, the daily 61.8% fib level is at 1.2661, expected to provide resistance.
GBP/USD struggles to defend the week-start rebound while making rounds to 1.2625-30 amid the early hours of Tuesday’s Asian session. In doing so, the Cable pair jostles with the 50-SMA as full markets return after the US Labor Day Holiday. Apart from the 50-SMA, cautious mood ahead of the final readings of the UK S&P Global/CIPS PMIs for August and the US Factory Orders for the said month also prods the Pound Sterling.
It’s worth noting, however, that the GBP/USD pair’s successful rebound from an ascending trend line stretched from late May, around 1.2580 by the press time, joins the looming bull cross on the MACD indicator to keep the buyers hopeful.
With this, the quote is likely to overcome the immediate SMA hurdle surrounding 1.2630. The same will allow the Cable pair to prod a five-week-long falling resistance line near the 1.2700 threshold.
However, the Pound Sterling’s upside past 1.2700 will be decisive as it will then have only one hurdle, namely the 200-SMA level of around 1.2740, to cross before inviting buyers home.
Alternatively, the GBP/USD pair’s downside appears elusive unless it stays beyond the aforementioned support line stretched from May, close to 1.2580.
Following that, a three-month-old horizontal support line of around 1.2550 will be important as it holds the key to the Pound Sterling’s slump toward the sub-1.2500 zone.
Overall, the GBP/USD pair is likely to keep the latest gains but the road towards the north appears bumpy.
Trend: Limited upside expected
Technical Levels: Supports and Resistances
GBPUSD currently trading at 1.2628 at the time of writing. Pair opened at 1.259 and is trading with a change of 0.30% % .
| Overview | Overview.1 | |
|---|---|---|
| 0 | Today last price | 1.2628 |
| 1 | Today Daily Change | 0.0038 |
| 2 | Today Daily Change % | 0.30% |
| 3 | Today daily open | 1.259 |
The pair is trading below its 20 Daily moving average @ 1.2693, below its 50 Daily moving average @ 1.2777 , below its 100 Daily moving average @ 1.265 and above its 200 Daily moving average @ 1.2416
| Trends | Trends.1 | |
|---|---|---|
| 0 | Daily SMA20 | 1.2693 |
| 1 | Daily SMA50 | 1.2777 |
| 2 | Daily SMA100 | 1.2650 |
| 3 | Daily SMA200 | 1.2416 |
The previous day high was 1.2713 while the previous day low was 1.2578. The daily 38.2% Fib levels comes at 1.2629, expected to provide resistance. Similarly, the daily 61.8% fib level is at 1.2661, expected to provide resistance.
Note the levels of interest below:
- Pivot support is noted at 1.2541, 1.2491, 1.2405
- Pivot resistance is noted at 1.2676, 1.2762, 1.2812
| Levels | Levels.1 |
|---|---|
| Previous Daily High | 1.2713 |
| Previous Daily Low | 1.2578 |
| Previous Weekly High | 1.2746 |
| Previous Weekly Low | 1.2563 |
| Previous Monthly High | 1.2841 |
| Previous Monthly Low | 1.2548 |
| Daily Fibonacci 38.2% | 1.2629 |
| Daily Fibonacci 61.8% | 1.2661 |
| Daily Pivot Point S1 | 1.2541 |
| Daily Pivot Point S2 | 1.2491 |
| Daily Pivot Point S3 | 1.2405 |
| Daily Pivot Point R1 | 1.2676 |
| Daily Pivot Point R2 | 1.2762 |
| Daily Pivot Point R3 | 1.2812 |
[/s2If]
Download Nehcap EAWe have two EAs that are operational on our LIVE accounts.
- EA-FIX: Check out the details here. Download EA-FIX . EA-FIX is a non-grid HFT scalper.
- EA-GROWTH: High quality low dd EA using trend grids. Download EA_GROWTHJoin Our Telegram Group


