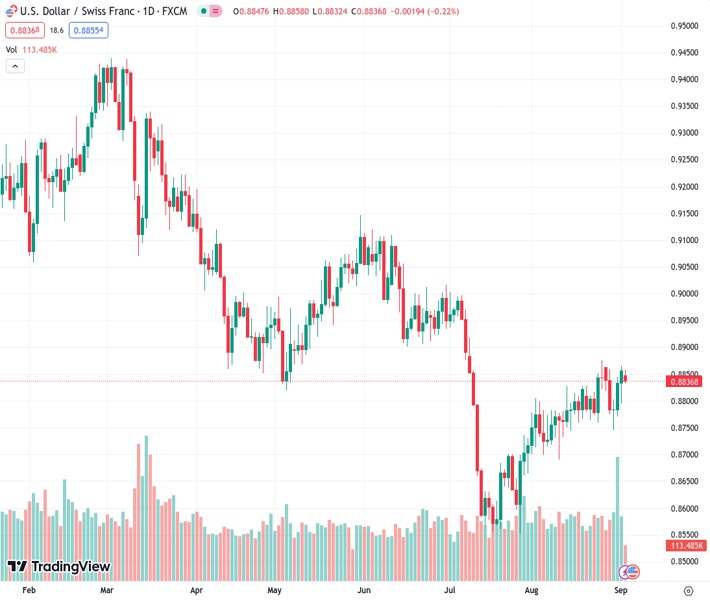
The currency pair USDCHF is currently trading at 0.8845 levels, experiencing slight declines.
…
This is a premium post.
[s2If !current_user_can(access_s2member_level4)]Please register for FREE REGISTER to read full post below containing analysis. In case of any error or you think you are not able to read the full post below, please email us at support#nehcap.com [lwa][/s2If] [s2If current_user_can(access_s2member_level1)]
- USD/CHF trades at the 0.8845 zone with mild losses.
The pair currently trades last at 0.88436.
The previous day high was 0.8864 while the previous day low was 0.8795. The daily 38.2% Fib levels comes at 0.8838, expected to provide support. Similarly, the daily 61.8% fib level is at 0.8821, expected to provide support.
The USD/CHF has traded sideways since early August in the 0.8700 – 0.88450 range, with bulls failing to gather momentum and seeming to await fresh catalysts.
According to the daily chart, the technical outlook for the USD/CHF remains neutral. The Relative Strength Index (RSI) indicates a stagnant bullish momentum with a flat slope above its midline, while the Moving Average Convergence (MACD) prints unchanged green bars. The four-hour chart also shows a clear neutral bias with no clear dominance and indicators having turned flat.
On the bigger picture, the pair is above the 20-day Simple Moving Average (SMA) but below the 100 and 200-day SMAs, suggesting that despite the recent bearish sentiment, the bulls are still resilient, holding some momentum but that for the longer term, the bears have the upperhand. Traders should eye the convergence of the 20 and 100-day SMA towards the 0.8850 – 0.8880 range as they are about to perform a bullish cross. It’s worth mentioning that when a shorter-term SMA crosses above a longer-term SMA, it’s usually considered bullish for the pair in the short term.
For this week, a fundamental catalyst is the release of the ISM Services PMI from the US which could influence the bets of the markets on the next Federal Reserve (Fed) decisions and, hence, the USD price dynamics.
Support levels: 0.8800 (20-day SMA), 0.8750, 0.8700.
Resistance levels: 0.8850, 0.8880 (100-day SMA), 0.8900.
Technical Levels: Supports and Resistances
USDCHF currently trading at 0.8847 at the time of writing. Pair opened at 0.8857 and is trading with a change of -0.11 % .
| Overview | Overview.1 | |
|---|---|---|
| 0 | Today last price | 0.8847 |
| 1 | Today Daily Change | -0.0010 |
| 2 | Today Daily Change % | -0.1100 |
| 3 | Today daily open | 0.8857 |
The pair is trading above its 20 Daily moving average @ 0.8796, above its 50 Daily moving average @ 0.8783 , below its 100 Daily moving average @ 0.8882 and below its 200 Daily moving average @ 0.9067
| Trends | Trends.1 | |
|---|---|---|
| 0 | Daily SMA20 | 0.8796 |
| 1 | Daily SMA50 | 0.8783 |
| 2 | Daily SMA100 | 0.8882 |
| 3 | Daily SMA200 | 0.9067 |
The previous day high was 0.8864 while the previous day low was 0.8795. The daily 38.2% Fib levels comes at 0.8838, expected to provide support. Similarly, the daily 61.8% fib level is at 0.8821, expected to provide support.
Note the levels of interest below:
- Pivot support is noted at 0.8814, 0.877, 0.8745
- Pivot resistance is noted at 0.8882, 0.8907, 0.8951
| Levels | Levels.1 |
|---|---|
| Previous Daily High | 0.8864 |
| Previous Daily Low | 0.8795 |
| Previous Weekly High | 0.8865 |
| Previous Weekly Low | 0.8745 |
| Previous Monthly High | 0.8876 |
| Previous Monthly Low | 0.8690 |
| Daily Fibonacci 38.2% | 0.8838 |
| Daily Fibonacci 61.8% | 0.8821 |
| Daily Pivot Point S1 | 0.8814 |
| Daily Pivot Point S2 | 0.8770 |
| Daily Pivot Point S3 | 0.8745 |
| Daily Pivot Point R1 | 0.8882 |
| Daily Pivot Point R2 | 0.8907 |
| Daily Pivot Point R3 | 0.8951 |
[/s2If]
Download Nehcap EAWe have two EAs that are operational on our LIVE accounts.
- EA-FIX: Check out the details here. Download EA-FIX . EA-FIX is a non-grid HFT scalper.
- EA-GROWTH: High quality low dd EA using trend grids. Download EA_GROWTHJoin Our Telegram Group


