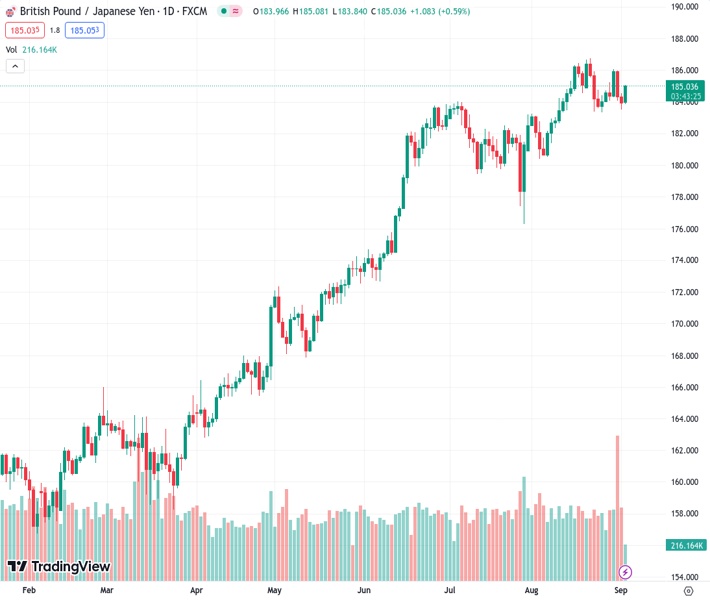
The GBPJPY pair, currently trading at 185.026, experienced a significant increase to 185.00, achieving a daily gain of close to 0.50%. This rise helped the pair recover from its previous decline below the 20-day Simple Moving Average (SMA).
…
This is a premium post.
[s2If !current_user_can(access_s2member_level4)]Please register for FREE REGISTER to read full post below containing analysis. In case of any error or you think you are not able to read the full post below, please email us at support#nehcap.com [lwa][/s2If] [s2If current_user_can(access_s2member_level1)]
- GBP/JPY jumped to 185.00, seeing nearly 0.50% daily gains, recovering the 20-day SMA.
The pair currently trades last at 185.026.
The previous day high was 184.56 while the previous day low was 183.54. The daily 38.2% Fib levels comes at 183.93, expected to provide support. Similarly, the daily 61.8% fib level is at 184.17, expected to provide support.
At the start of the week, the GBP/JPY cross jumped towards 185.00 and recovered the 20-day Simple Moving Average (SMA) of 184.60. No relevant economic data will be released on the session for either country, and monetary policy divergences favour the GBP over the JPY.
On the Pound’s side, the UK will have a quiet week, with the final revisions of PMIs on Tuesday being the only highlight. As for now, World Interest Rates Probabilities (WIRP) shows that market participants are discounting higher odds of the Bank of England (BoE) increasing rates by an additional 0.50% of tightening beyond the December meeting, resulting in a total increase to the 5.75%- 6% range. In line with that, the expectations of a more aggressive BoE may limit the GBP’s losses against its rivals.
On the other hand, the BoJ’s recent statements underline their commitment to aligning monetary policy with local wage and inflation trends. In that sense, Japan will report household spending figures from July on Tuesday and cash earnings data from July on Friday, which will give further insights to market participants and the BoJ into the current situation of the Japanese economy. Unless the bank does not see the required wage growth, it will likely maintain its dovish approach, leaving the JPY vulnerable.
The technical analysis of the daily chart suggests a neutral to bullish stance for GBP/JPY as the bulls work on recovering their ground. The Relative Strength Index (RSI) exhibits a bullish inclination with a positive slope above the 50 threshold, while the Moving Average Convergence (MACD) prints weaker red bars. Additionally, the pair is above the 20,100,200-day Simple Moving Average (SMA), pointing towards the prevailing strength of the bulls in the larger context.
Support levels: 183.50, 183.00, 182.00.
Resistance levels: 185.00, 186.00, 187.00.
Technical Levels: Supports and Resistances
GBPJPY currently trading at 185.0 at the time of writing. Pair opened at 184.1 and is trading with a change of 0.49 % .
| Overview | Overview.1 | |
|---|---|---|
| 0 | Today last price | 185.00 |
| 1 | Today Daily Change | 0.90 |
| 2 | Today Daily Change % | 0.49 |
| 3 | Today daily open | 184.10 |
The pair remains strongly bullish on the daily timeframe. It trades above its 20 SMA @ 184.52, 50 SMA 182.97, 100 SMA @ 177.78 and 200 SMA @ 169.98.
| Trends | Trends.1 | |
|---|---|---|
| 0 | Daily SMA20 | 184.52 |
| 1 | Daily SMA50 | 182.97 |
| 2 | Daily SMA100 | 177.78 |
| 3 | Daily SMA200 | 169.98 |
The previous day high was 184.56 while the previous day low was 183.54. The daily 38.2% Fib levels comes at 183.93, expected to provide support. Similarly, the daily 61.8% fib level is at 184.17, expected to provide support.
Note the levels of interest below:
- Pivot support is noted at 183.57, 183.05, 182.55
- Pivot resistance is noted at 184.59, 185.08, 185.61
| Levels | Levels.1 |
|---|---|
| Previous Daily High | 184.56 |
| Previous Daily Low | 183.54 |
| Previous Weekly High | 186.07 |
| Previous Weekly Low | 183.54 |
| Previous Monthly High | 186.77 |
| Previous Monthly Low | 180.46 |
| Daily Fibonacci 38.2% | 183.93 |
| Daily Fibonacci 61.8% | 184.17 |
| Daily Pivot Point S1 | 183.57 |
| Daily Pivot Point S2 | 183.05 |
| Daily Pivot Point S3 | 182.55 |
| Daily Pivot Point R1 | 184.59 |
| Daily Pivot Point R2 | 185.08 |
| Daily Pivot Point R3 | 185.61 |
[/s2If]
Download Nehcap EAWe have two EAs that are operational on our LIVE accounts.
- EA-FIX: Check out the details here. Download EA-FIX . EA-FIX is a non-grid HFT scalper.
- EA-GROWTH: High quality low dd EA using trend grids. Download EA_GROWTHJoin Our Telegram Group


