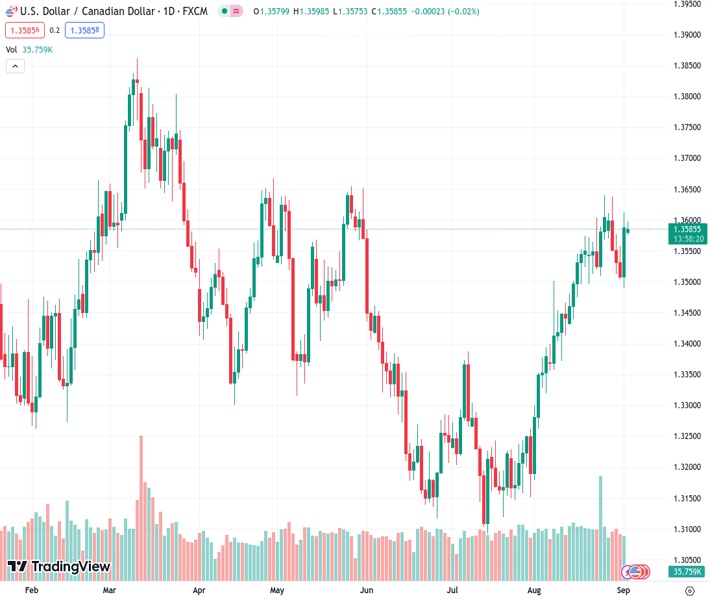
The USDCAD currency pair, trading at 1.35870, experiences its largest daily increase in a month as the market consolidates the previous day’s actions on account of the US Labor Day holiday. Nehcap’s perspective suggests that a retreat is anticipated.
…
This is a premium post.
[s2If !current_user_can(access_s2member_level4)]Please register for FREE REGISTER to read full post below containing analysis. In case of any error or you think you are not able to read the full post below, please email us at support#nehcap.com [lwa][/s2If] [s2If current_user_can(access_s2member_level1)]
- USD/CAD pares the biggest daily gain in a month as market consolidates Friday’s moves amid US Labor Day holiday.
The pair currently trades last at 1.35870.
The previous day high was 1.3613 while the previous day low was 1.3489. The daily 38.2% Fib levels comes at 1.3566, expected to provide support. Similarly, the daily 61.8% fib level is at 1.3536, expected to provide support.
USD/CAD clings to mild losses around 1.3585 heading into Monday’s European session as market players consolidate Friday’s heavy gains amid a sluggish start to the week’s trading.
In doing so, the Loonie pair aptly portrays the USD/CAD pair trader’s cautious mood ahead of the Bank of Canada (BoC) Interest Rate Decision, as well as the Canadian employment data for August.
Technically, the bearish MACD signals join the USD/CAD pair’s U-turn from a downward-sloping resistance line from late April, around 1.3610 at the latest, keeping the Loonie pair sellers hopeful.
However, a daily closing beneath the 61.8% Fibonacci retracement of its March–July downside, near 1.3570, becomes necessary to convince intraday sellers of the USD/CAD. It’s worth noting that the stated Fibonacci retracement is also known as the Golden Fibonacci ratio.
Following that, the 21-DMA and 200-DMA, respectively near 1.3520 and 1.3465, will act as the final defense of the USD/CAD buyers.
Meanwhile, a daily closing beyond the aforementioned resistance line stretched from April, close to 1.3610 at the latest, could convince the USD/CAD bulls to prod the previous monthly high of around 1.3640.
In a case where the Loonie pair buyers keep the reins, the tops marked in May and April, close to 1.3655 and 1.3670, could act as additional upside filters before directing the prices toward the yearly top marked in March around 1.3860.
Trend: Pullback expected
Technical Levels: Supports and Resistances
USDCAD currently trading at 1.3585 at the time of writing. Pair opened at 1.3594 and is trading with a change of -0.07% % .
| Overview | Overview.1 | |
|---|---|---|
| 0 | Today last price | 1.3585 |
| 1 | Today Daily Change | -0.0009 |
| 2 | Today Daily Change % | -0.07% |
| 3 | Today daily open | 1.3594 |
The pair remains strongly bullish on the daily timeframe. It trades above its 20 SMA @ 1.3514, 50 SMA 1.3346, 100 SMA @ 1.3396 and 200 SMA @ 1.3464.
| Trends | Trends.1 | |
|---|---|---|
| 0 | Daily SMA20 | 1.3514 |
| 1 | Daily SMA50 | 1.3346 |
| 2 | Daily SMA100 | 1.3396 |
| 3 | Daily SMA200 | 1.3464 |
The previous day high was 1.3613 while the previous day low was 1.3489. The daily 38.2% Fib levels comes at 1.3566, expected to provide support. Similarly, the daily 61.8% fib level is at 1.3536, expected to provide support.
Note the levels of interest below:
- Pivot support is noted at 1.3518, 1.3442, 1.3395
- Pivot resistance is noted at 1.3642, 1.3689, 1.3765
| Levels | Levels.1 |
|---|---|
| Previous Daily High | 1.3613 |
| Previous Daily Low | 1.3489 |
| Previous Weekly High | 1.3637 |
| Previous Weekly Low | 1.3489 |
| Previous Monthly High | 1.3640 |
| Previous Monthly Low | 1.3184 |
| Daily Fibonacci 38.2% | 1.3566 |
| Daily Fibonacci 61.8% | 1.3536 |
| Daily Pivot Point S1 | 1.3518 |
| Daily Pivot Point S2 | 1.3442 |
| Daily Pivot Point S3 | 1.3395 |
| Daily Pivot Point R1 | 1.3642 |
| Daily Pivot Point R2 | 1.3689 |
| Daily Pivot Point R3 | 1.3765 |
[/s2If]
Download Nehcap EAWe have two EAs that are operational on our LIVE accounts.
- EA-FIX: Check out the details here. Download EA-FIX . EA-FIX is a non-grid HFT scalper.
- EA-GROWTH: High quality low dd EA using trend grids. Download EA_GROWTHJoin Our Telegram Group
")


