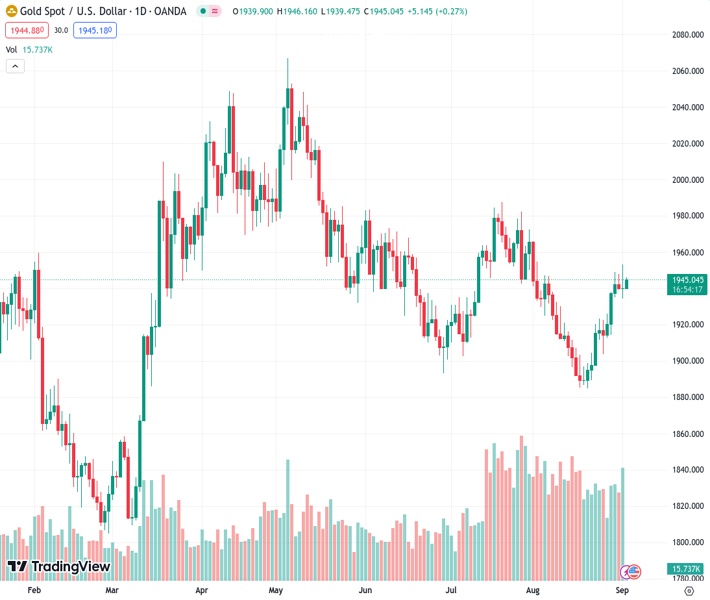
The price of gold, symbolized as XAUUSD at 1,945.02, is experiencing a renewed upward movement and continues to stay close to the highest point it has reached in the past month.
…
This is a premium post.
[s2If !current_user_can(access_s2member_level4)]Please register for FREE REGISTER to read full post below containing analysis. In case of any error or you think you are not able to read the full post below, please email us at support#nehcap.com [lwa][/s2If] [s2If current_user_can(access_s2member_level1)]
- Gold price regains positive traction and remains within the striking distance of a one-month top.
The pair currently trades last at 1945.02.
The previous day high was 1953.01 while the previous day low was 1934.43. The daily 38.2% Fib levels comes at 1941.53, expected to provide support. Similarly, the daily 61.8% fib level is at 1945.91, expected to provide resistance.
Gold price attracts fresh buying on the first day of a new week and steadily climbs back above the $1,945 level during the Asian session. The XAU/USD remains well within the striking distance of a one-month high, around the $1,952-$1,953 region touched on Friday and seems poised to build on its recent goodish rebound from over a five-month trough, around the $1,885 zone touched in August.
The mixed monthly jobs report released from the United States (US) on Friday ensured that the Federal Reserve (Fed) will leave interest rates unchanged at its September policy meeting, which, in turn, is seen benefitting the non-yielding Gold price. In fact, the headline NFP showed that the US economy added 187K jobs in August, higher than market expectations. That said, the previous month’s reading was revised down from 187K to 157K. Furthermore, the unemployment rate climbed to 3.8% from 3.5% in July and Average Hourly Earnings edged lower to 4.3% on a yearly basis from 4.4%. The data points to a slight deterioration in the labour market and gives the Fed less headroom to keep raising interest rates.
The outlook fails to assist the US Dollar (USD) to capitalize on its strong gains registered over the past two trading days and turns out to be another factor lending support to the Gold price. A softer buck tends to underpin demand for US Dollar-denominated commodities, including the XAU/USD. The downside for the USD, however, remains cushioned as the markets are still pricing in the possibility of one more 25 basis points (bps) Fed rate hike move by the end of this year. This remains supportive of elevated US Treasury bond yields and continues to act as a tailwind for the Greenback. Apart from this, a generally positive tone around the equity markets might contribute to capping gains for the safe-haven precious metal.
Expectations that the Fed is nearing the end of its rate-hiking cycle, along with the optimism over more supportive measures from China to shore up economic growth, continue to boost investors’ confidence. In fact, China’s top economic planner – the National Development and Reform Commission (NDRC) – said this Monday that it would establish a designated department to bolster the country’s faltering private economy. This comes after China increased local dollar liquidity and loosened some mortgage rules last week. In the absence of any relevant market-moving economic releases and a bank holiday in the US, the risk-on flow might hold back traders from placing aggressive bullish bets around the Gold price, at least for now.
Technical Levels: Supports and Resistances
XAUUSD currently trading at 1945.47 at the time of writing. Pair opened at 1939.76 and is trading with a change of 0.29 % .
| Overview | Overview.1 | |
|---|---|---|
| 0 | Today last price | 1945.47 |
| 1 | Today Daily Change | 5.71 |
| 2 | Today Daily Change % | 0.29 |
| 3 | Today daily open | 1939.76 |
The pair is trading above its 20 Daily moving average @ 1915.12, above its 50 Daily moving average @ 1931.27 , below its 100 Daily moving average @ 1954.29 and above its 200 Daily moving average @ 1914.87
| Trends | Trends.1 | |
|---|---|---|
| 0 | Daily SMA20 | 1915.12 |
| 1 | Daily SMA50 | 1931.27 |
| 2 | Daily SMA100 | 1954.29 |
| 3 | Daily SMA200 | 1914.87 |
The previous day high was 1953.01 while the previous day low was 1934.43. The daily 38.2% Fib levels comes at 1941.53, expected to provide support. Similarly, the daily 61.8% fib level is at 1945.91, expected to provide resistance.
Note the levels of interest below:
- Pivot support is noted at 1931.79, 1923.82, 1913.21
- Pivot resistance is noted at 1950.37, 1960.98, 1968.95
| Levels | Levels.1 |
|---|---|
| Previous Daily High | 1953.01 |
| Previous Daily Low | 1934.43 |
| Previous Weekly High | 1953.01 |
| Previous Weekly Low | 1912.84 |
| Previous Monthly High | 1966.08 |
| Previous Monthly Low | 1884.85 |
| Daily Fibonacci 38.2% | 1941.53 |
| Daily Fibonacci 61.8% | 1945.91 |
| Daily Pivot Point S1 | 1931.79 |
| Daily Pivot Point S2 | 1923.82 |
| Daily Pivot Point S3 | 1913.21 |
| Daily Pivot Point R1 | 1950.37 |
| Daily Pivot Point R2 | 1960.98 |
| Daily Pivot Point R3 | 1968.95 |
[/s2If]
Download Nehcap EAWe have two EAs that are operational on our LIVE accounts.
- EA-FIX: Check out the details here. Download EA-FIX . EA-FIX is a non-grid HFT scalper.
- EA-GROWTH: High quality low dd EA using trend grids. Download EA_GROWTHJoin Our Telegram Group


