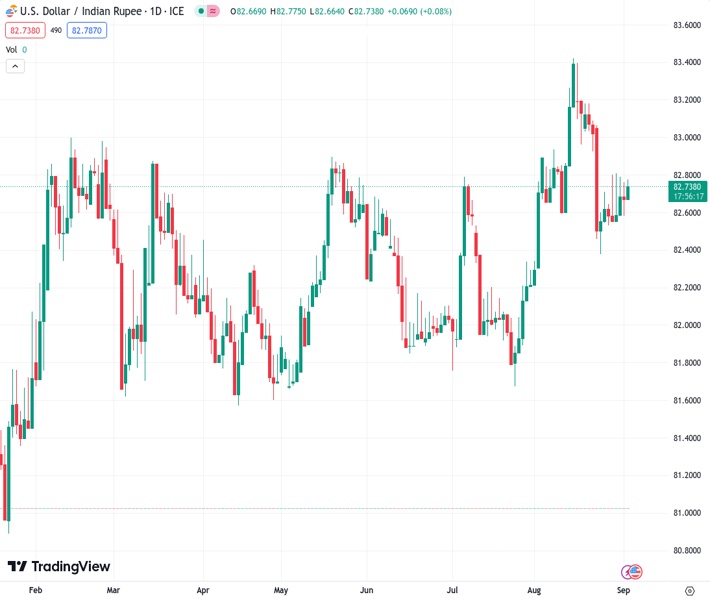
The USD to INR exchange rate, which was at 82.7560, ended its two-day decline during a slow Asian trading session.
…
This is a premium post.
[s2If !current_user_can(access_s2member_level4)]Please register for FREE REGISTER to read full post below containing analysis. In case of any error or you think you are not able to read the full post below, please email us at support#nehcap.com [lwa][/s2If] [s2If current_user_can(access_s2member_level1)]
- USD/INR snaps two-day losing streak amid sluggish Asian session.
The pair currently trades last at 82.7560.
The previous day high was 82.8424 while the previous day low was 82.546. The daily 38.2% Fib levels comes at 82.6593, expected to provide support. Similarly, the daily 61.8% fib level is at 82.7292, expected to provide support.
USD/INR bears relinquish controls after ruling in the last two consecutive days, despite lacking momentum around 82.65–70 amid early Monday. In doing so, the Indian Rupee (INR) pair takes clues from the Asian market optimism, mainly driven by China, as well as the US Dollar’s retreat amid the US Labor Day holiday.
Markets in Asia cheer China’s readiness for multiple measures to defend the world’s second-largest economy. Among the latest actions, the government’s establishment of a special cell to promote the private economy and opening up barriers for the services industry gained major attention.
In the last week, China’s central bank, namely the People’s Bank of China (PBoC), announced a heavy cut to its foreign exchange reserve requirement ratio (FX RRR) to 4% from 6.0% effective from September 15.
That said, a slew of China banks cut interest rates on Yuan deposits to ease the pressure from lower mortgage rates announced previously. Among them, ICBC, China Industrial Bank, Agricultural Bank of China and Bank of China (BoC) gained major attention. Additionally, Reuters cited four people familiar with the matter to report that China is likely to step up action to revive the country’s property sector.
It’s worth noting, however, that the US-China tension, mainly due to the concerns that American businesses are less comfortable in Beijing, as well as US President Joe Biden’s readiness to restore ties with Taiwan, prod the market’s optimism and the USD/INR losses. Furthermore, an absence of major market moves due to the US holiday and a light calendar in Asia also restricts the Indian Rupee (INR) pair’s latest moves.
Even so, India’s second quarter (Q2) Gross Domestic Product (GDP) offered a positive surprise the previous week by rising to 7.8% YoY from 6.1% previous readings and 7.7% market forecasts, which in turn weighs on the USD/INR price.
On the other hand, a downward revision to the Q2 US GDP growth and softer PMIs contrasted with the upbeat prints of inflation clues and mostly impressive employment statistics. With this, the US Dollar managed to close on the positive side for the seventh consecutive week despite marking the lowest weekly gain since early July.
US Nonfarm Payrolls (NFP) rose to 187K in August versus 170K expected and 157K prior (revised) even as the Unemployment Rate marked an uptick to 3.8% from 3.5% market forecasts and previous readings. Further, the Average Hourly Earnings also eased to 0.2% and 4.3% compared to 0.4% and 4.4% respective priors. Additionally, the US ISM Manufacturing PMI also impressed the US Dollar buyers with the 47.6 figures versus analysts’ estimation of 47.0 versus 46.4 previous readings. Following the data, Federal Reserve Bank of Cleveland President Loretta J. Mester advocated for hawkish monetary policy and allowed the Greenback to remain firmer the previous day.
Amid these plays, the US Dollar Index (DXY) snaps a two-day winning streak with mild losses to around 104.15 whereas the S&P 500 Futures print mild losses and stocks in the Asia-Pacific zone edge higher of late. It’s worth noting that the benchmark US 10-year Treasury bond yields dropped in the last two consecutive weeks after rising to the highest levels since 2007, to 4.18% at the latest.
Looking forward, a light calendar and the US holiday may allow the USD/INR bears to keep the reins. However, headlines about China and the US Federal Reserve, as well as the US ISM Services PMI, will be the key for clear directions.
USD/INR remains pressured between the 21-day Simple Moving Average (SMA) and the 50-SMA, respectively around 82.90 and 82.50 by the press time.
Technical Levels: Supports and Resistances
USDINR currently trading at 82.684 at the time of writing. Pair opened at 82.7245 and is trading with a change of -0.05% % .
| Overview | Overview.1 | |
|---|---|---|
| 0 | Today last price | 82.684 |
| 1 | Today Daily Change | -0.0405 |
| 2 | Today Daily Change % | -0.05% |
| 3 | Today daily open | 82.7245 |
The pair is trading below its 20 Daily moving average @ 82.91, above its 50 Daily moving average @ 82.5017 , above its 100 Daily moving average @ 82.3562 and above its 200 Daily moving average @ 82.2877
| Trends | Trends.1 | |
|---|---|---|
| 0 | Daily SMA20 | 82.9100 |
| 1 | Daily SMA50 | 82.5017 |
| 2 | Daily SMA100 | 82.3562 |
| 3 | Daily SMA200 | 82.2877 |
The previous day high was 82.8424 while the previous day low was 82.546. The daily 38.2% Fib levels comes at 82.6593, expected to provide support. Similarly, the daily 61.8% fib level is at 82.7292, expected to provide support.
Note the levels of interest below:
- Pivot support is noted at 82.5662, 82.4079, 82.2698
- Pivot resistance is noted at 82.8626, 83.0007, 83.159
| Levels | Levels.1 |
|---|---|
| Previous Daily High | 82.8424 |
| Previous Daily Low | 82.5460 |
| Previous Weekly High | 82.8978 |
| Previous Weekly Low | 82.4635 |
| Previous Monthly High | 83.5505 |
| Previous Monthly Low | 82.2240 |
| Daily Fibonacci 38.2% | 82.6593 |
| Daily Fibonacci 61.8% | 82.7292 |
| Daily Pivot Point S1 | 82.5662 |
| Daily Pivot Point S2 | 82.4079 |
| Daily Pivot Point S3 | 82.2698 |
| Daily Pivot Point R1 | 82.8626 |
| Daily Pivot Point R2 | 83.0007 |
| Daily Pivot Point R3 | 83.1590 |
[/s2If]
Download Nehcap EAWe have two EAs that are operational on our LIVE accounts.
- EA-FIX: Check out the details here. Download EA-FIX . EA-FIX is a non-grid HFT scalper.
- EA-GROWTH: High quality low dd EA using trend grids. Download EA_GROWTHJoin Our Telegram Group


