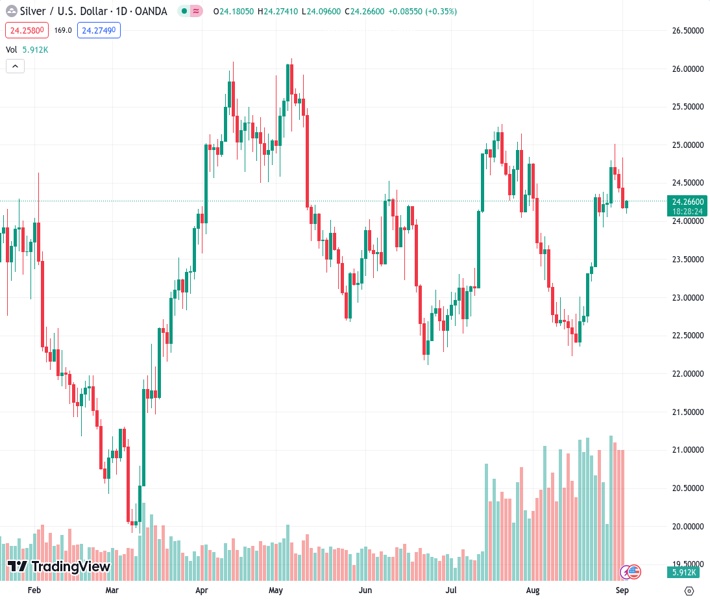
Silver prices have slightly increased, putting an end to a three-day period of losses. However, it is predicted that there will only be a slight improvement in the market.
…
This is a premium post.
[s2If !current_user_can(access_s2member_level4)]Please register for FREE REGISTER to read full post below containing analysis. In case of any error or you think you are not able to read the full post below, please email us at support#nehcap.com [lwa][/s2If] [s2If current_user_can(access_s2member_level1)]
- Silver Price prints mild gains while snapping three-day losing streak.
The pair currently trades last at 24.255.
The previous day high was 24.82 while the previous day low was 24.16. The daily 38.2% Fib levels comes at 24.41, expected to provide resistance. Similarly, the daily 61.8% fib level is at 24.57, expected to provide resistance.
Silver Price (XAG/USD) picks up bids to defend the week-start rebound above the $24.00 amid early Monday in Asia. In doing so, the XAG/USD prints the first daily gain in four while reversing from the 10-day Exponential Moving Average (EMA).
Apart from the Silver Price rebound from the 10-EMA, the bullish MACD signals and the upbeat RSI (14) line, not overbought, also underpins the Silver Price recovery to $24.25 by the press time.
However, a convergence of the commodity’s 23.6% Fibonacci retracement of the March–May upside and a four-month-old downward-sloping trend line, close to $24.75–80 at the latest, appears the key for the XAG/USD bulls to cross to retake control.
Following that, the Silver Price run-up towards the previous monthly high of around $25.00 and July’s peak of $25.30 will be in the spotlight.
Meanwhile, a downside break of the 10-EMA level of $24.10, needs validation from the $24.00 round figure to convince the intraday sellers of the Silver.
Even so, the 50-EMA and 38.2% Fibonacci retracement together offer a tough nut to crack for the Silver bears around $23.75.
To sum up, the XAG/USD is likely to portray a corrective bounce amid the US Labor Day Holiday.
Trend: Limited recovery expected
Technical Levels: Supports and Resistances
XAGUSD currently trading at 24.25 at the time of writing. Pair opened at 24.18 and is trading with a change of 0.29% % .
| Overview | Overview.1 | |
|---|---|---|
| 0 | Today last price | 24.25 |
| 1 | Today Daily Change | 0.07 |
| 2 | Today Daily Change % | 0.29% |
| 3 | Today daily open | 24.18 |
The pair remains strongly bullish on the daily timeframe. It trades above its 20 SMA @ 23.43, 50 SMA 23.68, 100 SMA @ 23.93 and 200 SMA @ 23.43.
| Trends | Trends.1 | |
|---|---|---|
| 0 | Daily SMA20 | 23.43 |
| 1 | Daily SMA50 | 23.68 |
| 2 | Daily SMA100 | 23.93 |
| 3 | Daily SMA200 | 23.43 |
The previous day high was 24.82 while the previous day low was 24.16. The daily 38.2% Fib levels comes at 24.41, expected to provide resistance. Similarly, the daily 61.8% fib level is at 24.57, expected to provide resistance.
Note the levels of interest below:
- Pivot support is noted at 23.95, 23.72, 23.28
- Pivot resistance is noted at 24.62, 25.06, 25.29
| Levels | Levels.1 |
|---|---|
| Previous Daily High | 24.82 |
| Previous Daily Low | 24.16 |
| Previous Weekly High | 25.02 |
| Previous Weekly Low | 24.05 |
| Previous Monthly High | 25.02 |
| Previous Monthly Low | 22.23 |
| Daily Fibonacci 38.2% | 24.41 |
| Daily Fibonacci 61.8% | 24.57 |
| Daily Pivot Point S1 | 23.95 |
| Daily Pivot Point S2 | 23.72 |
| Daily Pivot Point S3 | 23.28 |
| Daily Pivot Point R1 | 24.62 |
| Daily Pivot Point R2 | 25.06 |
| Daily Pivot Point R3 | 25.29 |
[/s2If]
Download Nehcap EAWe have two EAs that are operational on our LIVE accounts.
- EA-FIX: Check out the details here. Download EA-FIX . EA-FIX is a non-grid HFT scalper.
- EA-GROWTH: High quality low dd EA using trend grids. Download EA_GROWTHJoin Our Telegram Group


