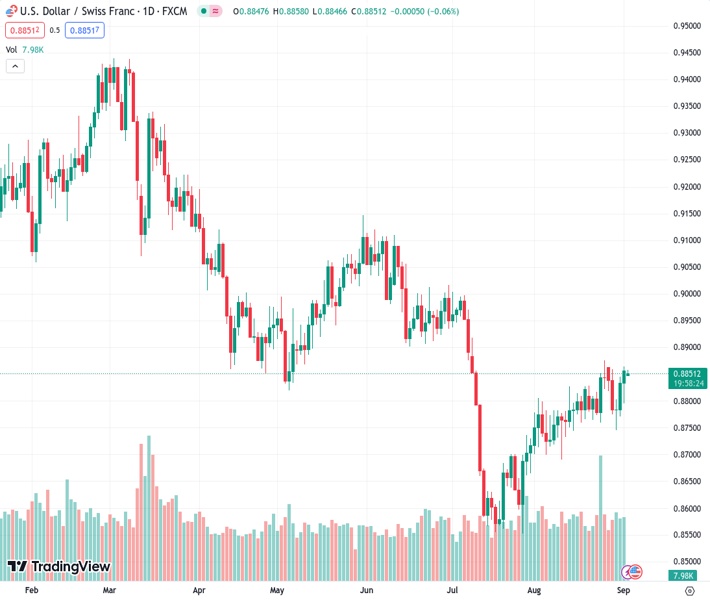
On Monday, the USDCHF pair at a rate of 0.88517, remains within a tight range of trading around 0.8850.
…
This is a premium post.
[s2If !current_user_can(access_s2member_level4)]Please register for FREE REGISTER to read full post below containing analysis. In case of any error or you think you are not able to read the full post below, please email us at support#nehcap.com [lwa][/s2If] [s2If current_user_can(access_s2member_level1)]
- USD/CHF consolidates in a narrow trading band around 0.8850 on Monday.
The pair currently trades last at 0.88517.
The previous day high was 0.8864 while the previous day low was 0.8795. The daily 38.2% Fib levels comes at 0.8838, expected to provide support. Similarly, the daily 61.8% fib level is at 0.8821, expected to provide support.
The USD/CHF pair remains confined between 0.8852-0.8862 range during the early Asian trading hours on Monday. Meanwhile, the US Dollar Index (DXY), a measure of the value of USD against six other major currencies, holds above the 104.00 mark, while the US bond yields have a volatile session following the US economic data. The 2-year yield currently trades around 4.87% after falling to a three-week low of 4.76% and the 10-year bonds trade near 4.18%. At the time of writing, the USD/CHF is trading at 0.8855, losing 0.02% on the day.
Data released on Friday showed that Nonfarm Payrolls (NFP) for August in the US came in at 187,000, exceeding the estimate of 170,000 and July’s reading of 157,000. The Unemployment Rate decreased considerably to 3.8%, compared to the market’s estimate of 3.5% and the previous reading of 3.5%. The monthly Average Hourly Earnings increased by 0.2% instead of 0.3%. The US Dollar (USD) weakened across the board following the data released as traders anticipate that the Federal Reserve is likely to end the tightening cycle.
However, the Greenback reversed its direction after the US PMI data. That said, the US Manufacturing PMI came in at 47.6 versus 46.4 previously and above market expectations of 47.0.
On the other hand, the Swiss Real Retail Sales YoY for July came in at -2.2% versus 1.8% prior, the Swiss Federal Statistical Office reported last week. Additionally, the KOF Leading Indicator for August came in at 91.1 versus 92.01 prior and below the market consensus of 91.5. Finally, the ZEW Survey of Expectation for the same period fell to -38.6 from -32.6 the previous month and missed the expectation of -31.3. The weaker-than-expected Swiss data dragged the Swiss Franc (CHF) lower against its rivals.
However, The renewed trade war tension between the US and China might benefit the traditional safe-haven CHF and act as a headwind for USD/CHF. US Commerce Secretary Raimondo said that China is making the situation more difficult. He added that a lack of a predictable environment and a fair playing field are the primary drivers affecting US business in China. On the weekend, Chinese President Xi Jinping stated at the China International Fair for Trade in Services (CIFTIS) in Beijing that China will encourage the integrated development of high-end manufacturing and modern service industries, according to Reuters.
Looking ahead, market players will closely watch the Swiss Gross Domestic Product (GDP) for the second quarter. The quarterly and annual growth number is expected to grow 0.1% and 0.5%, respectively. On the US docket, the US ISM Services PMI for August will be released on Wednesday. These figures could give a clear direction for the USD/CHF pair.
Technical Levels: Supports and Resistances
USDCHF currently trading at 0.8851 at the time of writing. Pair opened at 0.8857 and is trading with a change of -0.07 % .
| Overview | Overview.1 | |
|---|---|---|
| 0 | Today last price | 0.8851 |
| 1 | Today Daily Change | -0.0006 |
| 2 | Today Daily Change % | -0.0700 |
| 3 | Today daily open | 0.8857 |
The pair is trading above its 20 Daily moving average @ 0.8796, above its 50 Daily moving average @ 0.8783 , below its 100 Daily moving average @ 0.8882 and below its 200 Daily moving average @ 0.9067
| Trends | Trends.1 | |
|---|---|---|
| 0 | Daily SMA20 | 0.8796 |
| 1 | Daily SMA50 | 0.8783 |
| 2 | Daily SMA100 | 0.8882 |
| 3 | Daily SMA200 | 0.9067 |
The previous day high was 0.8864 while the previous day low was 0.8795. The daily 38.2% Fib levels comes at 0.8838, expected to provide support. Similarly, the daily 61.8% fib level is at 0.8821, expected to provide support.
Note the levels of interest below:
- Pivot support is noted at 0.8814, 0.877, 0.8745
- Pivot resistance is noted at 0.8882, 0.8907, 0.8951
| Levels | Levels.1 |
|---|---|
| Previous Daily High | 0.8864 |
| Previous Daily Low | 0.8795 |
| Previous Weekly High | 0.8865 |
| Previous Weekly Low | 0.8745 |
| Previous Monthly High | 0.8876 |
| Previous Monthly Low | 0.8690 |
| Daily Fibonacci 38.2% | 0.8838 |
| Daily Fibonacci 61.8% | 0.8821 |
| Daily Pivot Point S1 | 0.8814 |
| Daily Pivot Point S2 | 0.8770 |
| Daily Pivot Point S3 | 0.8745 |
| Daily Pivot Point R1 | 0.8882 |
| Daily Pivot Point R2 | 0.8907 |
| Daily Pivot Point R3 | 0.8951 |
[/s2If]
Download Nehcap EAWe have two EAs that are operational on our LIVE accounts.
- EA-FIX: Check out the details here. Download EA-FIX . EA-FIX is a non-grid HFT scalper.
- EA-GROWTH: High quality low dd EA using trend grids. Download EA_GROWTHJoin Our Telegram Group


