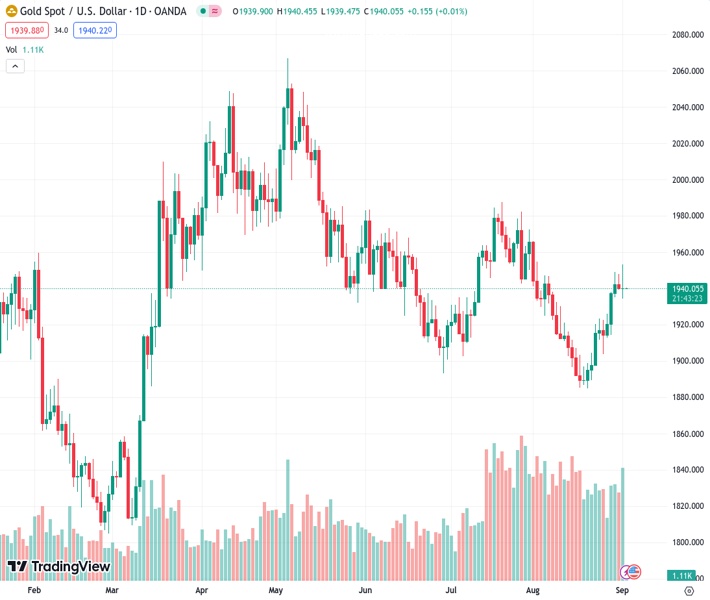
The price of gold, denoted by #XAUUSD, is staying steady at approximately $1,940 after experiencing a period of uncertainty.
…
This is a premium post.
[s2If !current_user_can(access_s2member_level4)]Please register for FREE REGISTER to read full post below containing analysis. In case of any error or you think you are not able to read the full post below, please email us at support#nehcap.com [lwa][/s2If] [s2If current_user_can(access_s2member_level1)]
- Gold price remains flat around $1,940 following the volatility session.
The pair currently trades last at 1939.91.
The previous day high was 1953.01 while the previous day low was 1934.43. The daily 38.2% Fib levels comes at 1941.53, expected to provide resistance. Similarly, the daily 61.8% fib level is at 1945.91, expected to provide resistance.
Gold price (XAU/USD) is currently in consolidation mode around $1,940 during the early Asian session on Monday. The US market is closed for the Labor Day holiday and gold price is expected to remain under pressure amid the thin trading volume. Later this week, the US ISM Services PMI for August will be released and the data will likely ramp up volatility.
On Friday, gold price surged above the key resistance level of $1,950 and then reversed its direction to $1,934 after the release of US ISM Manufacturing PMI data for August. The US Bureau of Labor Statistics revealed that Nonfarm Payrolls (NFP) for August came in at 187,000, better than expected at 170,000 and July’s reading of 157,000.
The Unemployment Rate improved sharply to 3.8% versus the market consensus and the previous reading of 3.5%. The Average Hourly Earning rose by 0.2% MoM, worse than expectations of 0.3%. Additionally, the Institute for Supply Management (ISM) showed on Friday that the US Manufacturing PMI came in at 47.6 versus 46.4 prior and higher than anticipated at 47.0.
Meanwhile, the US Dollar Index (DXY), a measure of the value of USD against a basket of currencies used by US trade partners, gains traction above 104.25 after bouncing off the low of 103.27. The US bond yields have a volatile session following the US economic data. The 2-year yield currently trades around 4.87% after falling to a three-week low of 4.76% while the 10-year bonds trades near 4.18%. According to the CME FedWatch tool, markets have priced in that the Federal Reverse will not hike rates in its September meeting and the odds of raising rates in November and December have declined to around 35%.
Looking ahead, gold traders will keep an eye on the US ISM Services PMI for August and the US ADP Employment Change due later on Wednesday for fresh impetus. These figures could give a clear direction to gold price.
Technical Levels: Supports and Resistances
XAUUSD currently trading at 1939.66 at the time of writing. Pair opened at 1939.76 and is trading with a change of -0.01 % .
| Overview | Overview.1 | |
|---|---|---|
| 0 | Today last price | 1939.66 |
| 1 | Today Daily Change | -0.10 |
| 2 | Today Daily Change % | -0.01 |
| 3 | Today daily open | 1939.76 |
The pair is trading above its 20 Daily moving average @ 1915.12, above its 50 Daily moving average @ 1931.27 , below its 100 Daily moving average @ 1954.29 and above its 200 Daily moving average @ 1914.87
| Trends | Trends.1 | |
|---|---|---|
| 0 | Daily SMA20 | 1915.12 |
| 1 | Daily SMA50 | 1931.27 |
| 2 | Daily SMA100 | 1954.29 |
| 3 | Daily SMA200 | 1914.87 |
The previous day high was 1953.01 while the previous day low was 1934.43. The daily 38.2% Fib levels comes at 1941.53, expected to provide resistance. Similarly, the daily 61.8% fib level is at 1945.91, expected to provide resistance.
Note the levels of interest below:
- Pivot support is noted at 1931.79, 1923.82, 1913.21
- Pivot resistance is noted at 1950.37, 1960.98, 1968.95
| Levels | Levels.1 |
|---|---|
| Previous Daily High | 1953.01 |
| Previous Daily Low | 1934.43 |
| Previous Weekly High | 1953.01 |
| Previous Weekly Low | 1912.84 |
| Previous Monthly High | 1966.08 |
| Previous Monthly Low | 1884.85 |
| Daily Fibonacci 38.2% | 1941.53 |
| Daily Fibonacci 61.8% | 1945.91 |
| Daily Pivot Point S1 | 1931.79 |
| Daily Pivot Point S2 | 1923.82 |
| Daily Pivot Point S3 | 1913.21 |
| Daily Pivot Point R1 | 1950.37 |
| Daily Pivot Point R2 | 1960.98 |
| Daily Pivot Point R3 | 1968.95 |
[/s2If]
Download Nehcap EAWe have two EAs that are operational on our LIVE accounts.
- EA-FIX: Check out the details here. Download EA-FIX . EA-FIX is a non-grid HFT scalper.
- EA-GROWTH: High quality low dd EA using trend grids. Download EA_GROWTHJoin Our Telegram Group


