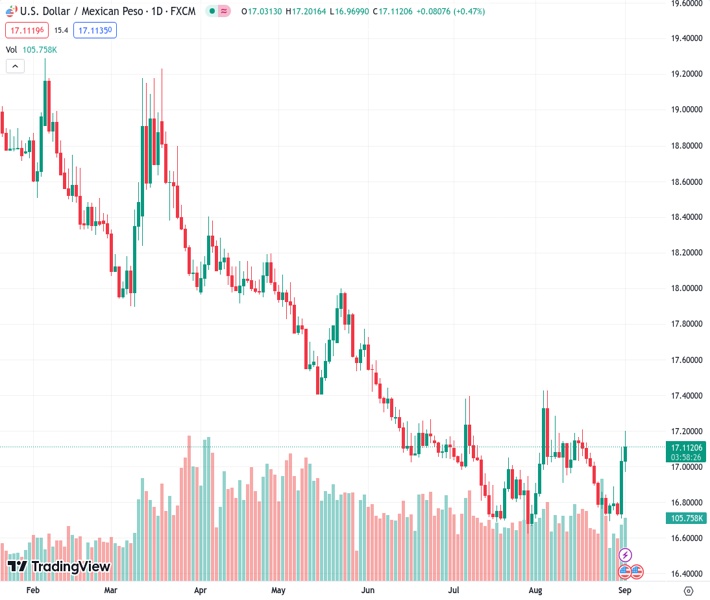
The US dollar to Mexican peso exchange rate, currently at 17.1079, has increased to 17.1222, marking a 0.56% rise. This comes after it rebounded from its lowest point of the day at 16.9699.
…
This is a premium post.
[s2If !current_user_can(access_s2member_level4)]Please register for FREE REGISTER to read full post below containing analysis. In case of any error or you think you are not able to read the full post below, please email us at support#nehcap.com [lwa][/s2If] [s2If current_user_can(access_s2member_level1)]
- USD/MXN trades at 17.1222, up by 0.56%, recovering from a daily low of 16.9699.
The pair currently trades last at 17.1079.
The previous day high was 17.115 while the previous day low was 16.7087. The daily 38.2% Fib levels comes at 16.9598, expected to provide support. Similarly, the daily 61.8% fib level is at 16.8639, expected to provide support.
The American Dollar (USD) recovered some ground against the Mexican Peso (MXN), gaining earlier in the session, diving to a daily low of 16.9699. Still, recent economic data from the United States (US) and high US yields weighed on the emerging market currency, which trims its gains to 12.09% in the year. The USD/MXN is trading at 17.1222, edges high by 0.56%.
Before Wall Street opened, the US Department of Labor revealed the US economy added 187K jobs to the economy, the same number as July, which could have been positive for the Greenback but wasn’t. The Unemployment Rate ticked up by 0.3% from 3.5% to 3.8%, approaching the Federal Reserve’s (Fed) target of 4.1% throughout 2023.
Initially, the USD/MXN dropped like a stone from daily highs of around 17.2000, below the 17.0000 figure, as investors weighed that Jerome Powell and Co would not continue to tighten monetary policy. However, traders booked profits ahead of additional market-moving data.
After the employment report, the ISM Manufacturing PMI for August showed signs of improvement, rising to 47.6 from 46.4 in July, yet remained in contractionary territory. Most of the subcomponents rose, except for new orders, which remained depressed, but factory inventories remaining at lower levels could spur a jump in orders in the near term.
The markets reacted oppositely, following the business activity report, even though traders pared additional rate hikes by the Fed, and as of today, expect the first rate cut by May 2024, as shown by the CME FedWatch Tool. The USD/MXN reversed its course and climbed towards 17.1500 but failed to gain traction to lift the exchange rates to new weekly highs above 17.2012.
On the Mexican front, the Bank of Mexico (Banxico) decided to cut its hedging program and reported over $5.65 billion in remittances in July, edging near the monthly record of $5.70 billion hit last May. Also, the August S&P Global Manufacturing PMI report came at 51.2 vs. 53.2 in July, portraying slight weakness in the sector.
From a technical standpoint, the USD/MXN has broken to the upside, set to register its most significant weekly gain of more than 2.40%. Buyers are eyeing a break of a downslope resistance trendline drawn from April 2023 highs of 18.4010, which, once cleared, could put the May 17 swing low of 17.4038 as crucial resistance. A breach of the latter would put a challenge of the 18.0000 figure into the table.
Technical Levels: Supports and Resistances
USDMXN currently trading at 17.101 at the time of writing. Pair opened at 17.0435 and is trading with a change of 0.34 % .
| Overview | Overview.1 | |
|---|---|---|
| 0 | Today last price | 17.1010 |
| 1 | Today Daily Change | 0.0575 |
| 2 | Today Daily Change % | 0.3400 |
| 3 | Today daily open | 17.0435 |
The pair is trading above its 20 Daily moving average @ 16.9812, above its 50 Daily moving average @ 16.9738 , below its 100 Daily moving average @ 17.314 and below its 200 Daily moving average @ 18.076
| Trends | Trends.1 | |
|---|---|---|
| 0 | Daily SMA20 | 16.9812 |
| 1 | Daily SMA50 | 16.9738 |
| 2 | Daily SMA100 | 17.3140 |
| 3 | Daily SMA200 | 18.0760 |
The previous day high was 17.115 while the previous day low was 16.7087. The daily 38.2% Fib levels comes at 16.9598, expected to provide support. Similarly, the daily 61.8% fib level is at 16.8639, expected to provide support.
Note the levels of interest below:
- Pivot support is noted at 16.7964, 16.5494, 16.3901
- Pivot resistance is noted at 17.2028, 17.3621, 17.6092
| Levels | Levels.1 |
|---|---|
| Previous Daily High | 17.1150 |
| Previous Daily Low | 16.7087 |
| Previous Weekly High | 17.0800 |
| Previous Weekly Low | 16.7366 |
| Previous Monthly High | 17.4274 |
| Previous Monthly Low | 16.6945 |
| Daily Fibonacci 38.2% | 16.9598 |
| Daily Fibonacci 61.8% | 16.8639 |
| Daily Pivot Point S1 | 16.7964 |
| Daily Pivot Point S2 | 16.5494 |
| Daily Pivot Point S3 | 16.3901 |
| Daily Pivot Point R1 | 17.2028 |
| Daily Pivot Point R2 | 17.3621 |
| Daily Pivot Point R3 | 17.6092 |
[/s2If]
Download Nehcap EAWe have two EAs that are operational on our LIVE accounts.
- EA-FIX: Check out the details here. Download EA-FIX . EA-FIX is a non-grid HFT scalper.
- EA-GROWTH: High quality low dd EA using trend grids. Download EA_GROWTHJoin Our Telegram Group


