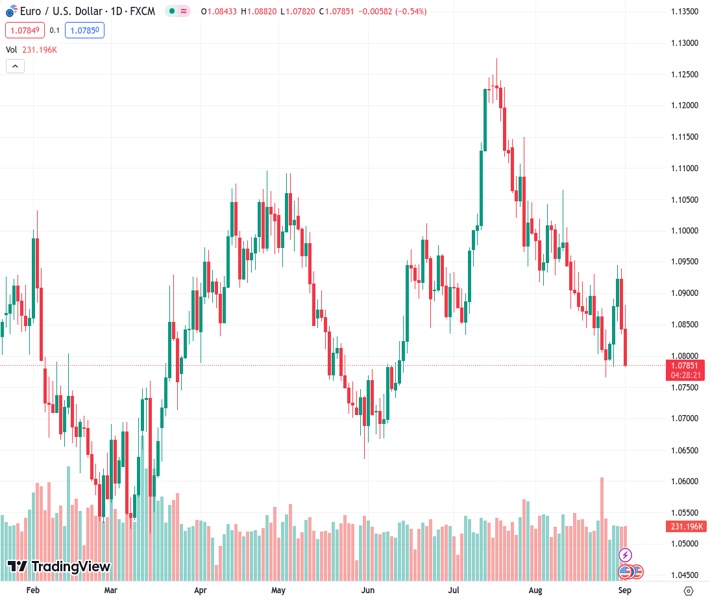
The EURUSD pair reached a high of 1.0880 before falling to 1.0785, which is below the 200-day Simple Moving Average (SMA) of 1.0815.
…
This is a premium post.
[s2If !current_user_can(access_s2member_level4)]Please register for FREE REGISTER to read full post below containing analysis. In case of any error or you think you are not able to read the full post below, please email us at support#nehcap.com [lwa][/s2If] [s2If current_user_can(access_s2member_level1)]
- After initially rising to 1.0880, the EUR/USD declined to 1.0785, below the 200-day SMA of 1.0815.
The pair currently trades last at 1.07840.
The previous day high was 1.094 while the previous day low was 1.0835. The daily 38.2% Fib levels comes at 1.0875, expected to provide resistance. Similarly, the daily 61.8% fib level is at 1.09, expected to provide resistance.
Following the release of a mixed Nonfarm Payrolls report, which saw employment rising higher than expected, wages decelerating and the unemployment rate rising above expectations in August, the USD reversed its course on the back of stronger Institute for Supply Management (ISM) PMIs.
The manufacturing index rose above expectations but showed that the sector remains in a contraction area, coming in at 47.6 vs. the 47 expected. The Employment index also beat expectations at 48.5 vs. the 44.2 expected.
The USD’s DXY index dropped to 103.27 after the NFPs but recovered after the better-than-expected PMI towards 104.22. US yields also saw volatility falling to lows since August 10 but cleared some losses. The decline of the yields hints at investors betting on lower odds of a Federal Reserve (Fed) hike this year. The CME FedWatch tool depicts that the likelihood of a 25 basis point (bps) increase declined to nearly 35% in November and December after rising nearly 50% this week. Ongoing data will continue helping investors model their expectations towards the upcoming September 20 meeting and as long as investors continue betting for no hikes for the remainder of 2023, the USD’s upside is limited.
Based on the daily chart, the EUR/USD exhibits a bearish outlook for the short term. The Relative Strength Index (RSI) and Moving Average Convergence Divergence (MACD) remain in negative territory, with the RSI below its midline and showing a southward slope. The MACD is also displaying red bars, indicating a strengthening bearish momentum. Additionally, the pair is below the 20,100 and 200-day Simple Moving Averages (SMAs), pointing towards the prevailing strength of the bears in the larger context and the buyers facing a challenging situation.
Support levels:1.0780, 1.0760, 1.0730.
Resistance levels: 1.0815 (200-day SMA), 1.0830, 1.0890 (20-day SMA)
Technical Levels: Supports and Resistances
EURUSD currently trading at 1.0783 at the time of writing. Pair opened at 1.0844 and is trading with a change of -0.56 % .
| Overview | Overview.1 | |
|---|---|---|
| 0 | Today last price | 1.0783 |
| 1 | Today Daily Change | -0.0061 |
| 2 | Today Daily Change % | -0.5600 |
| 3 | Today daily open | 1.0844 |
The pair remains strongly bearish on the daily time frame. It trades below the 20 SMA @ 1.0899, 50 SMA 1.097, 100 SMA @ 1.0924 and 200 SMA @ 1.0814.
| Trends | Trends.1 | |
|---|---|---|
| 0 | Daily SMA20 | 1.0899 |
| 1 | Daily SMA50 | 1.0970 |
| 2 | Daily SMA100 | 1.0924 |
| 3 | Daily SMA200 | 1.0814 |
The previous day high was 1.094 while the previous day low was 1.0835. The daily 38.2% Fib levels comes at 1.0875, expected to provide resistance. Similarly, the daily 61.8% fib level is at 1.09, expected to provide resistance.
Note the levels of interest below:
- Pivot support is noted at 1.0806, 1.0768, 1.0702
- Pivot resistance is noted at 1.091, 1.0977, 1.1015
| Levels | Levels.1 |
|---|---|
| Previous Daily High | 1.0940 |
| Previous Daily Low | 1.0835 |
| Previous Weekly High | 1.0930 |
| Previous Weekly Low | 1.0766 |
| Previous Monthly High | 1.1065 |
| Previous Monthly Low | 1.0766 |
| Daily Fibonacci 38.2% | 1.0875 |
| Daily Fibonacci 61.8% | 1.0900 |
| Daily Pivot Point S1 | 1.0806 |
| Daily Pivot Point S2 | 1.0768 |
| Daily Pivot Point S3 | 1.0702 |
| Daily Pivot Point R1 | 1.0910 |
| Daily Pivot Point R2 | 1.0977 |
| Daily Pivot Point R3 | 1.1015 |
[/s2If]
Download Nehcap EAWe have two EAs that are operational on our LIVE accounts.
- EA-FIX: Check out the details here. Download EA-FIX . EA-FIX is a non-grid HFT scalper.
- EA-GROWTH: High quality low dd EA using trend grids. Download EA_GROWTHJoin Our Telegram Group


