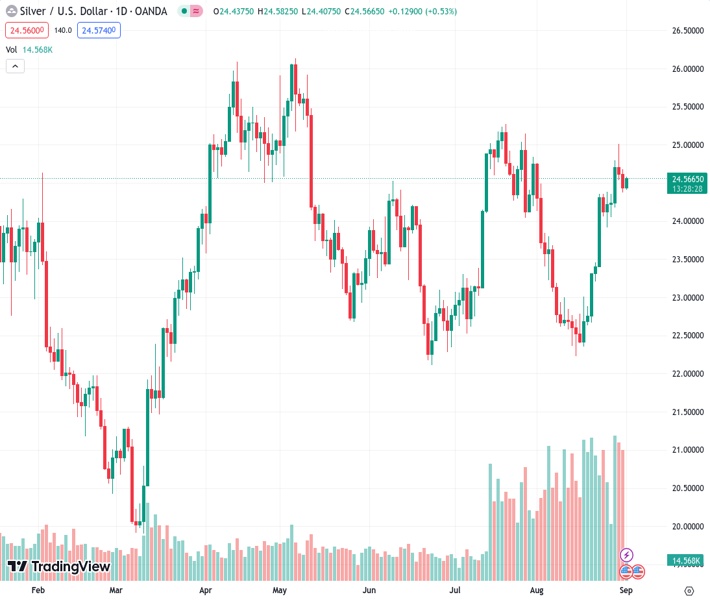
The XAGUSD, currently trading at a rate of 24.549, is experiencing an increase in value in anticipation of the release of US employment data.
…
This is a premium post.
[s2If !current_user_can(access_s2member_level4)]Please register for FREE REGISTER to read full post below containing analysis. In case of any error or you think you are not able to read the full post below, please email us at support#nehcap.com [lwa][/s2If] [s2If current_user_can(access_s2member_level1)]
- XAG/USD trades higher ahead of US employment data.
The pair currently trades last at 24.549.
The previous day high was 24.68 while the previous day low was 24.37. The daily 38.2% Fib levels comes at 24.49, expected to provide support. Similarly, the daily 61.8% fib level is at 24.56, expected to provide resistance.
XAG/USD snaps the two-day losing streak, trading higher around $24.50 during the early trading hours in the European session on Friday. The pair is experiencing upward support after the moderate inflation data from the United States (US) was released on Thursday. US Core Personal Consumption Expenditures (PCE) – Price Index, rose at the rate of 4.2% on a monthly basis in July as per the market consensus, from 4.1% prior.
However, the traders of the bright metal will likely monitor the releases of US employment and manufacturing data before making fresh bets on the XAG/USD pair. These datasets include the US Average Hourly Earnings, Nonfarm Payrolls and ISM Manufacturing PMI.
The 14-day Relative Strength Index (RSI) remains above 50, indicating a bullish bias of the XAG/USD traders. The bulls could face a challenge around the weekly high at $25.01, followed by July’s high at $25.26.
The Moving Average Convergence Divergence (MACD) line remains above the centerline and shows the divergence above the signal line, which indicates that recent momentum is stronger.
On the flip side, the seven-day Exponential Moving Average (EMA) at $24.30 emerges as the immediate support aligned to 23.6% Fibonacci retracement at $24.35.
A break below that level could push the Silver price to navigate the region around a nine-day EMA at $24.19, followed by a 38.2% Fibonacci retracement at $23.94.
Technical Levels: Supports and Resistances
XAGUSD currently trading at 24.52 at the time of writing. Pair opened at 24.41 and is trading with a change of 0.45 % .
| Overview | Overview.1 | |
|---|---|---|
| 0 | Today last price | 24.52 |
| 1 | Today Daily Change | 0.11 |
| 2 | Today Daily Change % | 0.45 |
| 3 | Today daily open | 24.41 |
The pair remains strongly bullish on the daily timeframe. It trades above its 20 SMA @ 23.4, 50 SMA 23.65, 100 SMA @ 23.95 and 200 SMA @ 23.42.
| Trends | Trends.1 | |
|---|---|---|
| 0 | Daily SMA20 | 23.40 |
| 1 | Daily SMA50 | 23.65 |
| 2 | Daily SMA100 | 23.95 |
| 3 | Daily SMA200 | 23.42 |
The previous day high was 24.68 while the previous day low was 24.37. The daily 38.2% Fib levels comes at 24.49, expected to provide support. Similarly, the daily 61.8% fib level is at 24.56, expected to provide resistance.
Note the levels of interest below:
- Pivot support is noted at 24.29, 24.18, 23.98
- Pivot resistance is noted at 24.6, 24.8, 24.91
| Levels | Levels.1 |
|---|---|
| Previous Daily High | 24.68 |
| Previous Daily Low | 24.37 |
| Previous Weekly High | 24.38 |
| Previous Weekly Low | 22.67 |
| Previous Monthly High | 25.02 |
| Previous Monthly Low | 22.23 |
| Daily Fibonacci 38.2% | 24.49 |
| Daily Fibonacci 61.8% | 24.56 |
| Daily Pivot Point S1 | 24.29 |
| Daily Pivot Point S2 | 24.18 |
| Daily Pivot Point S3 | 23.98 |
| Daily Pivot Point R1 | 24.60 |
| Daily Pivot Point R2 | 24.80 |
| Daily Pivot Point R3 | 24.91 |
[/s2If]
Download Nehcap EAWe have two EAs that are operational on our LIVE accounts.
- EA-FIX: Check out the details here. Download EA-FIX . EA-FIX is a non-grid HFT scalper.
- EA-GROWTH: High quality low dd EA using trend grids. Download EA_GROWTHJoin Our Telegram Group


