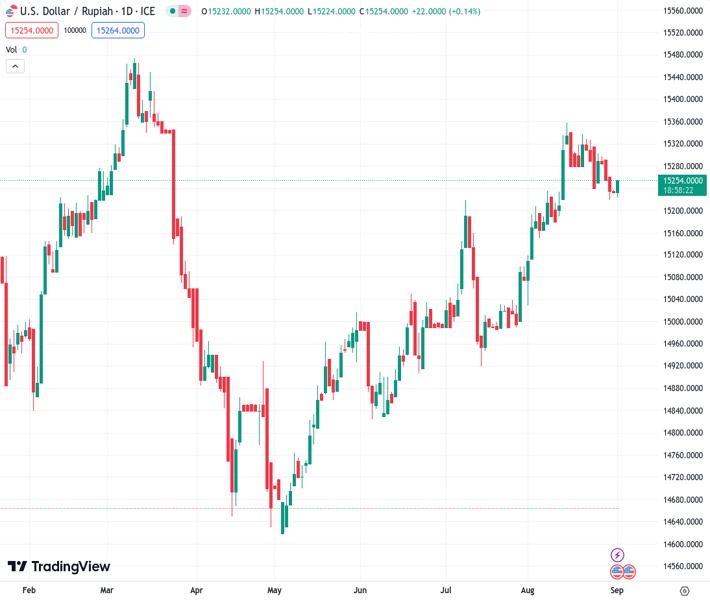
The US dollar to Indonesian rupiah exchange rate, currently at 15,255.0, is experiencing difficulty in maintaining its three-day period of success due to a combination of factors, including varying influences on the market and concerns leading up to the release of the non-farm payrolls report.
…
This is a premium post.
[s2If !current_user_can(access_s2member_level4)]Please register for FREE REGISTER to read full post below containing analysis. In case of any error or you think you are not able to read the full post below, please email us at support#nehcap.com [lwa][/s2If] [s2If current_user_can(access_s2member_level1)]
- USD/IDR struggles to defend three-day winning streak amid mixed catalysts, pre-NFP anxiety.
The pair currently trades last at 15255.0.
The previous day high was 15263.85 while the previous day low was 15198.0. The daily 38.2% Fib levels comes at 15238.6953, expected to provide support. Similarly, the daily 61.8% fib level is at 15223.1547, expected to provide support.
USD/IDR edges higher past 15,200, mildly bid near 15,230 by the press time, during a volatile Friday morning for the Asia-Pacific currencies. The pair’s latest moves aptly justify the downbeat Indonesia inflation, as well as the China-inspired risk-on mood, ahead of the top-tier US jobs report.
Indonesia’s Inflation gauge drops to -0.02% MoM from 0.21% prior, versus 0.10% expected whereas the yearly figures came in below forecasts but manage to post better figures with 3.27% YoY marks. Further, the Core Inflation also declines to 2.18% YoY compared to 2.43% prior and 2.30% expected.
While Indonesia data allows the USD/IDR pair to remain firmer for the third consecutive day, the upbeat mood in the Asia-Pacific zone, due to China stimulus measures and upbeat data from Beijing, cap the pair’s upside moves of late.
That said, China’s Caixin Manufacturing PMI for August rose to 51.0 versus 49.3 market forecasts and 49.2 previous readings. Further, the People’s Bank of China (PBoC) announced early Friday that it will lower the foreign exchange reserve requirement ratio to 4%, from 6.0%, effective from September 15. On the same line, a slew of China banks cut interest rates on Yuan deposits while citing the readiness to ease the pressure from lower mortgage rates, per Reuters. Among them, ICBC, China Industrial Bank, Agricultural Bank of China and Bank of China (BoC) gained major attention.
It’s worth observing that the US Dollar Index (DXY) fades the previous day’s corrective bounce off the 200-DMA as market players appear divided about the US Federal Reserve’s (Fed) next step considering the previous day’s mixed data versus earlier downbeat signals.
Talking about the US data, the Fed’s preferred inflation gauge, namely the US Core Personal Consumption Expenditure (PCE) Price Index for August, matched market forecasts of 4.2% YoY and 0.2% MoM versus 4.1% and 0.2% respectively priors. Further, the Initial Jobless Claims dropped to 228K from 232K prior (revised) versus 235K market forecasts while the Chicago Purchasing Managers’ Index rose to 48.7 for August compared to 44.1 expected and 42.8 previous readings. Additionally, Personal Spending rose past the 0.6% expected and previous readings to 0.8% for July whereas Personal Income eased to 0.2% for the said month, from the 0.3% market forecast and prior.
Looking forward, the US employment report for August will be crucial for the USD/IDR pair traders to watch for clear directions, especially after Atlanta Fed President Raphael Bostic defended the US central bank’s view of keeping rates high.
Forecasts suggest that the headline US Nonfarm Payrolls (NFP) could ease to 170K versus the previously upbeat outcomes of the JOLTS Job Openings, ADP Employment Change and higher prints of the US Continuing Jobless Claims. Additionally, the three-month average of the US NFP halves to 218K versus a year earlier. As a result, the overall scenario of the US job numbers appears downbeat and can only defend the USD/IDR by posting an extremely strong outcome.
Although the 200-DMA puts a floor under the USD/IDR price near 15,150, the pair buyers should remain cautious unless they witness a daily closing beyond the fortnight-old resistance line, close to 15,260 by the press time.
Technical Levels: Supports and Resistances
USDIDR currently trading at 15261 at the time of writing. Pair opened at 15225 and is trading with a change of 0.24% % .
| Overview | Overview.1 | |
|---|---|---|
| 0 | Today last price | 15261 |
| 1 | Today Daily Change | 36.0000 |
| 2 | Today Daily Change % | 0.24% |
| 3 | Today daily open | 15225 |
The pair is trading below its 20 Daily moving average @ 15270.44, above its 50 Daily moving average @ 15143.521 , above its 100 Daily moving average @ 15004.922 and above its 200 Daily moving average @ 15151.7715
| Trends | Trends.1 | |
|---|---|---|
| 0 | Daily SMA20 | 15270.4400 |
| 1 | Daily SMA50 | 15143.5210 |
| 2 | Daily SMA100 | 15004.9220 |
| 3 | Daily SMA200 | 15151.7715 |
The previous day high was 15263.85 while the previous day low was 15198.0. The daily 38.2% Fib levels comes at 15238.6953, expected to provide support. Similarly, the daily 61.8% fib level is at 15223.1547, expected to provide support.
Note the levels of interest below:
- Pivot support is noted at 15194.05, 15163.1, 15128.2
- Pivot resistance is noted at 15259.9, 15294.8, 15325.75
| Levels | Levels.1 |
|---|---|
| Previous Daily High | 15263.8500 |
| Previous Daily Low | 15198.0000 |
| Previous Weekly High | 15339.0000 |
| Previous Weekly Low | 15240.0000 |
| Previous Monthly High | 15397.2500 |
| Previous Monthly Low | 15080.0000 |
| Daily Fibonacci 38.2% | 15238.6953 |
| Daily Fibonacci 61.8% | 15223.1547 |
| Daily Pivot Point S1 | 15194.0500 |
| Daily Pivot Point S2 | 15163.1000 |
| Daily Pivot Point S3 | 15128.2000 |
| Daily Pivot Point R1 | 15259.9000 |
| Daily Pivot Point R2 | 15294.8000 |
| Daily Pivot Point R3 | 15325.7500 |
[/s2If]
Download Nehcap EAWe have two EAs that are operational on our LIVE accounts.
- EA-FIX: Check out the details here. Download EA-FIX . EA-FIX is a non-grid HFT scalper.
- EA-GROWTH: High quality low dd EA using trend grids. Download EA_GROWTHJoin Our Telegram Group


