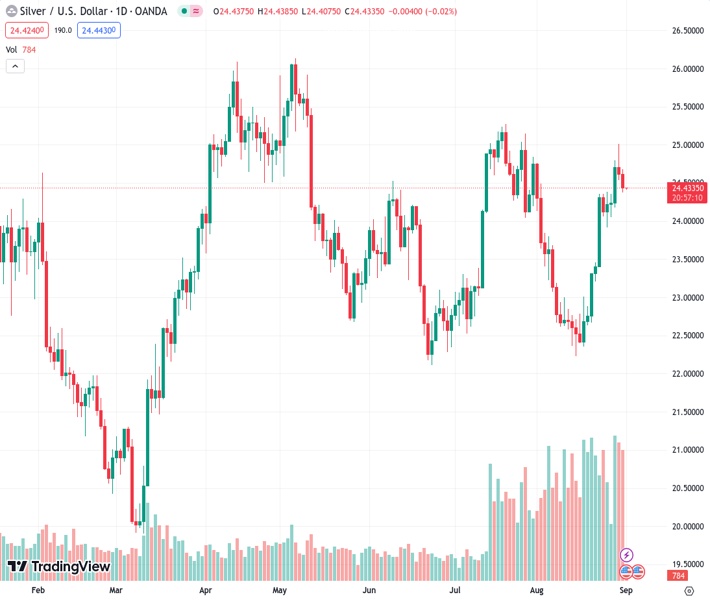
The price of silver, symbolized by #XAGUSD at 24.435, has stayed stagnant after confirming a bearish chart pattern known as a rising wedge that emerged a week ago. According to the viewpoint of @nehcap, it is anticipated that there will be more decline in the price.
…
This is a premium post.
[s2If !current_user_can(access_s2member_level4)]Please register for FREE REGISTER to read full post below containing analysis. In case of any error or you think you are not able to read the full post below, please email us at support#nehcap.com [lwa][/s2If] [s2If current_user_can(access_s2member_level1)]
- Silver Price remains sidelined after confirming one-week-old rising wedge bearish chart pattern.
The pair currently trades last at 24.435.
The previous day high was 25.02 while the previous day low was 24.53. The daily 38.2% Fib levels comes at 24.72, expected to provide resistance. Similarly, the daily 61.8% fib level is at 24.83, expected to provide resistance.
Silver Price (XAG/USD) remains on the back foot around $24.40 despite lacking downside momentum amid the early hours of Friday’s trading. In doing so, the bright metal portrays the market’s cautious mood ahead of the US employment report for August, including the headline Nonfarm Payrolls (NFP).
However, bearish MACD signals and the downbeat RSI (14) line, not overbought, join the confirmation of a one-week-old rising wedge bearish chart formation to keep the XAG/USD sellers hopeful.
With this, the Silver sellers appear well set to drop towards the 50-SMA level of around $24.15, a break of which could direct the XAG/USD toward the 200-SMA support of around $23.85.
It’s worth noting that the XAG/USD weakness past $23.85 will highlight the 38.2% Fibonacci retracement of the July-August downside, near $23.40, ahead of directing the sellers toward the mid-August swing high of around $23.00.
On the flip side, the Silver Price remains on the back foot unless defying the rising wedge chart formation, by crossing the stated wedge’s upper line near $25.05.
Even so, the tops marked during late July and the previous monthly high, respectively near $25.15 and $25.30, will act as the final defense of the Silver bears.
Trend: Further downside expected
Technical Levels: Supports and Resistances
XAGUSD currently trading at 24.42 at the time of writing. Pair opened at 24.61 and is trading with a change of -0.77% % .
| Overview | Overview.1 | |
|---|---|---|
| 0 | Today last price | 24.42 |
| 1 | Today Daily Change | -0.19 |
| 2 | Today Daily Change % | -0.77% |
| 3 | Today daily open | 24.61 |
The pair remains strongly bullish on the daily timeframe. It trades above its 20 SMA @ 23.36, 50 SMA 23.6, 100 SMA @ 23.96 and 200 SMA @ 23.4.
| Trends | Trends.1 | |
|---|---|---|
| 0 | Daily SMA20 | 23.36 |
| 1 | Daily SMA50 | 23.60 |
| 2 | Daily SMA100 | 23.96 |
| 3 | Daily SMA200 | 23.40 |
The previous day high was 25.02 while the previous day low was 24.53. The daily 38.2% Fib levels comes at 24.72, expected to provide resistance. Similarly, the daily 61.8% fib level is at 24.83, expected to provide resistance.
Note the levels of interest below:
- Pivot support is noted at 24.42, 24.24, 23.94
- Pivot resistance is noted at 24.91, 25.2, 25.39
| Levels | Levels.1 |
|---|---|
| Previous Daily High | 25.02 |
| Previous Daily Low | 24.53 |
| Previous Weekly High | 24.38 |
| Previous Weekly Low | 22.67 |
| Previous Monthly High | 25.27 |
| Previous Monthly Low | 22.52 |
| Daily Fibonacci 38.2% | 24.72 |
| Daily Fibonacci 61.8% | 24.83 |
| Daily Pivot Point S1 | 24.42 |
| Daily Pivot Point S2 | 24.24 |
| Daily Pivot Point S3 | 23.94 |
| Daily Pivot Point R1 | 24.91 |
| Daily Pivot Point R2 | 25.20 |
| Daily Pivot Point R3 | 25.39 |
[/s2If]
Download Nehcap EAWe have two EAs that are operational on our LIVE accounts.
- EA-FIX: Check out the details here. Download EA-FIX . EA-FIX is a non-grid HFT scalper.
- EA-GROWTH: High quality low dd EA using trend grids. Download EA_GROWTHJoin Our Telegram Group


