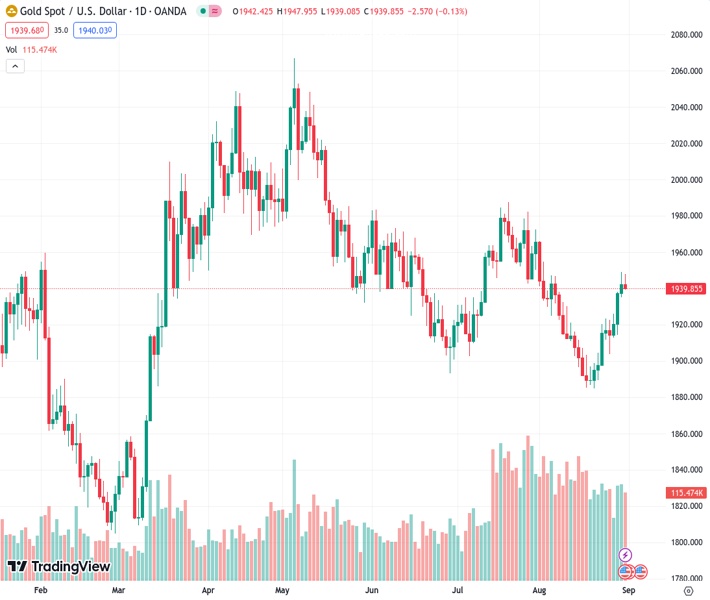
The XAUUSD pair experienced small declines on Thursday, trading close to the $1,940 level.
…
This is a premium post.
[s2If !current_user_can(access_s2member_level4)]Please register for FREE REGISTER to read full post below containing analysis. In case of any error or you think you are not able to read the full post below, please email us at support#nehcap.com [lwa][/s2If] [s2If current_user_can(access_s2member_level1)]
- XAU/USD traded with mild losses on Thursday, near the $1,940 area.
The pair currently trades last at 1939.50.
The previous day high was 1949.11 while the previous day low was 1935.01. The daily 38.2% Fib levels comes at 1943.72, expected to provide resistance. Similarly, the daily 61.8% fib level is at 1940.4, expected to provide resistance.
On Thursday, Gold price slightly decreased as the recovery of the USD limited the upside potential. The Greenback found demand as people filing first-time claims for state unemployment insurance decreased at the end of August, while the Personal Consumption Expenditures inflation figures increased, just as expected. Markets are cautious ahead of critical Nonfarm Payrolls (NFPs) from August that will be released on Friday.
From the data side, the US Department of Labor released robust figures for Initial Jobless Claims from August that came in at 228,000, versus the expected 235,000 and the previous reading of 232,000, while the Core Personal Consumption Expenditures (PCE)(YoY) from July came as expected 4.2% but slightly lower than the previous 4.1%.
That said, the US dollar, measured by the DXY index, showed more than 0.40% of daily gains while the US treasury bond yields, often seen as the opportunity cost of holding non-yielding metals, decreased. The 2,5 and 10-year yields declined to 4.86%, 4.24% and 4.08%, respectively, limiting the XAU/USD downside. The focus now shifts to the August Nonfarm Payrolls, where investors will watch for further clues about the next interest rate decisions by the Federal Reserve (Fed). As for now, the CME FedWatch Tool suggests that investors expect the Fed won’t hike on September 20, while the odds of 25 basis points (bps) stand 40% on November 1 and December 13. It’s worth highlighting that Chair Powell from the Fed stated that the bank is expecting the US labour market to soften and that ongoing decisions will be “carefully” decided, so the outcomes of the NFPs will likely dictate the pace of the mentioned expectations and the US Treasury yields on Friday.
According to the daily chart, the XAU/USD trades neutral to bearish in the short term, near the $1,940 area. The Relative Strength Index (RSI) trades flat, while the Moving Average Convergence Divergence (MACD) continues to print strong green bars, suggesting that the buyers are resilient. On the general outlook, the XAU/USD trades above the 20-day and 200-day Simple Moving Average (SMA) and is approaching the 100-day SMA, which indicates that the bulls are comfortably are command.
Resistance levels: $1,945, $1,954 (100-day SMA), $1,970
Support levels: $1,935, $1,915 (20 and 200-day convergence), $1,900.
Technical Levels: Supports and Resistances
XAUUSD currently trading at 1940.14 at the time of writing. Pair opened at 1942.42 and is trading with a change of -0.12 % .
| Overview | Overview.1 | |
|---|---|---|
| 0 | Today last price | 1940.14 |
| 1 | Today Daily Change | -2.28 |
| 2 | Today Daily Change % | -0.12 |
| 3 | Today daily open | 1942.42 |
The pair is trading above its 20 Daily moving average @ 1914.97, above its 50 Daily moving average @ 1930.37 , below its 100 Daily moving average @ 1955.94 and above its 200 Daily moving average @ 1913.01
| Trends | Trends.1 | |
|---|---|---|
| 0 | Daily SMA20 | 1914.97 |
| 1 | Daily SMA50 | 1930.37 |
| 2 | Daily SMA100 | 1955.94 |
| 3 | Daily SMA200 | 1913.01 |
The previous day high was 1949.11 while the previous day low was 1935.01. The daily 38.2% Fib levels comes at 1943.72, expected to provide resistance. Similarly, the daily 61.8% fib level is at 1940.4, expected to provide resistance.
Note the levels of interest below:
- Pivot support is noted at 1935.25, 1928.08, 1921.15
- Pivot resistance is noted at 1949.35, 1956.28, 1963.45
| Levels | Levels.1 |
|---|---|
| Previous Daily High | 1949.11 |
| Previous Daily Low | 1935.01 |
| Previous Weekly High | 1923.43 |
| Previous Weekly Low | 1884.85 |
| Previous Monthly High | 1987.54 |
| Previous Monthly Low | 1902.77 |
| Daily Fibonacci 38.2% | 1943.72 |
| Daily Fibonacci 61.8% | 1940.40 |
| Daily Pivot Point S1 | 1935.25 |
| Daily Pivot Point S2 | 1928.08 |
| Daily Pivot Point S3 | 1921.15 |
| Daily Pivot Point R1 | 1949.35 |
| Daily Pivot Point R2 | 1956.28 |
| Daily Pivot Point R3 | 1963.45 |
[/s2If]
Download Nehcap EAWe have two EAs that are operational on our LIVE accounts.
- EA-FIX: Check out the details here. Download EA-FIX . EA-FIX is a non-grid HFT scalper.
- EA-GROWTH: High quality low dd EA using trend grids. Download EA_GROWTHJoin Our Telegram Group


