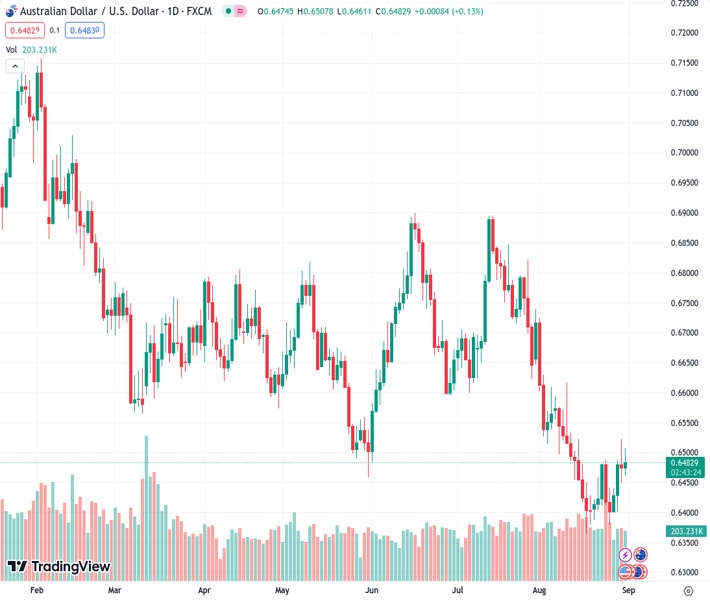
The AUDUSD pair remains unchanged at 0.64818 after dropping to a low of 0.6461 earlier in the day.
…
This is a premium post.
[s2If !current_user_can(access_s2member_level4)]Please register for FREE REGISTER to read full post below containing analysis. In case of any error or you think you are not able to read the full post below, please email us at support#nehcap.com [lwa][/s2If] [s2If current_user_can(access_s2member_level1)]
- AUD/USD trades flat after falling to a daily low of 0.6461.
The pair currently trades last at 0.64818.
The previous day high was 0.6522 while the previous day low was 0.6449. The daily 38.2% Fib levels comes at 0.6477, expected to provide support. Similarly, the daily 61.8% fib level is at 0.6494, expected to provide resistance.
The Australian Dollar (AUD) trims some of its losses against the US Dollar (USD) after falling to a daily low of 0.6461 ahead of the London fix, while the Greenback gives back some of its earlier gains. Traders booking profits ahead of market-moving data from the United States (US) is the main reason behind the recent US Dollar weakness. The AUD/USD is trading at 0.6474, flat in the day.
The financial markets remain quiet so far, past the mid-New York session. The economic agenda in the US spurred some volatility in the early trading session, courtesy of the latest inflation report. The Fed’s preferred gauge for inflation, the Personal Consumption Expenditure (PCE), was 3.3% YoY, as expected above June’s 3%. Regarding core PCE, sought by Fed officials, as its focal point is stickier than what policymakers were projecting, it stands at 4.s% YoY as foreseen but above the previous month’s 4.1%.
That data and the latest unemployment claims for the week ending August 26, coming below estimates of 235K, at 229K, sponsored a leg-up in the US Dollar. Initial Jobless Claims were the first positive news in the labor market during the week, as job openings plummeted, while private hiring disappointed analysts.
In the meantime, the US Dollar Index, which measures the buck’s value against a basket of six currencies, rises by 0.41%, at 103.606. US Treasury bond yields dropped
An upbeat market sentiment cushioned the AUD/USD as China revealed that Manufacturing PMIs improved but remained in contractionary territory. The non-manufacturing PMI deteriorateds from 51.5 to 51.0, below estimates of 51.1.
On the central bank front, Atlanta’s Fed President Raphael Bostic said the policy was appropriately restrictive to bring inflation towards the US central bank’s 2% target over a “reasonable” period.
In the week ahead, the Australian economic docket will feature S&P Global Manufacturing PMI for August. On the US front, the economic agenda is set to be busy, highlighted by the release of Nonfarm Payrolls and the ISM Manufacturing PMI, both of which are figures for August.
From a technical standpoint, the AUD/USD remains neutral to downward bias, as it remains below the 50 and 200-day Moving Averages (DMAs). Nevertheless, recent price action suggests the current leg-up could be viewed as a correction that pierced the 61.8% Fibonacci (Fib) retracement at 0.6520. That, alongside back-to-back spinning tops candlesticks, could pave the way for further losses, with traders eyeing the year-to-date (YTD) low of 0.6364
Technical Levels: Supports and Resistances
AUDUSD currently trading at 0.6477 at the time of writing. Pair opened at 0.6475 and is trading with a change of 0.03 % .
| Overview | Overview.1 | |
|---|---|---|
| 0 | Today last price | 0.6477 |
| 1 | Today Daily Change | 0.0002 |
| 2 | Today Daily Change % | 0.0300 |
| 3 | Today daily open | 0.6475 |
The pair is trading above its 20 Daily moving average @ 0.6474, below its 50 Daily moving average @ 0.6616 , below its 100 Daily moving average @ 0.6649 and below its 200 Daily moving average @ 0.6724
| Trends | Trends.1 | |
|---|---|---|
| 0 | Daily SMA20 | 0.6474 |
| 1 | Daily SMA50 | 0.6616 |
| 2 | Daily SMA100 | 0.6649 |
| 3 | Daily SMA200 | 0.6724 |
The previous day high was 0.6522 while the previous day low was 0.6449. The daily 38.2% Fib levels comes at 0.6477, expected to provide support. Similarly, the daily 61.8% fib level is at 0.6494, expected to provide resistance.
Note the levels of interest below:
- Pivot support is noted at 0.6442, 0.6409, 0.6369
- Pivot resistance is noted at 0.6515, 0.6555, 0.6588
| Levels | Levels.1 |
|---|---|
| Previous Daily High | 0.6522 |
| Previous Daily Low | 0.6449 |
| Previous Weekly High | 0.6488 |
| Previous Weekly Low | 0.6380 |
| Previous Monthly High | 0.6895 |
| Previous Monthly Low | 0.6599 |
| Daily Fibonacci 38.2% | 0.6477 |
| Daily Fibonacci 61.8% | 0.6494 |
| Daily Pivot Point S1 | 0.6442 |
| Daily Pivot Point S2 | 0.6409 |
| Daily Pivot Point S3 | 0.6369 |
| Daily Pivot Point R1 | 0.6515 |
| Daily Pivot Point R2 | 0.6555 |
| Daily Pivot Point R3 | 0.6588 |
[/s2If]
Download Nehcap EAWe have two EAs that are operational on our LIVE accounts.
- EA-FIX: Check out the details here. Download EA-FIX . EA-FIX is a non-grid HFT scalper.
- EA-GROWTH: High quality low dd EA using trend grids. Download EA_GROWTHJoin Our Telegram Group


