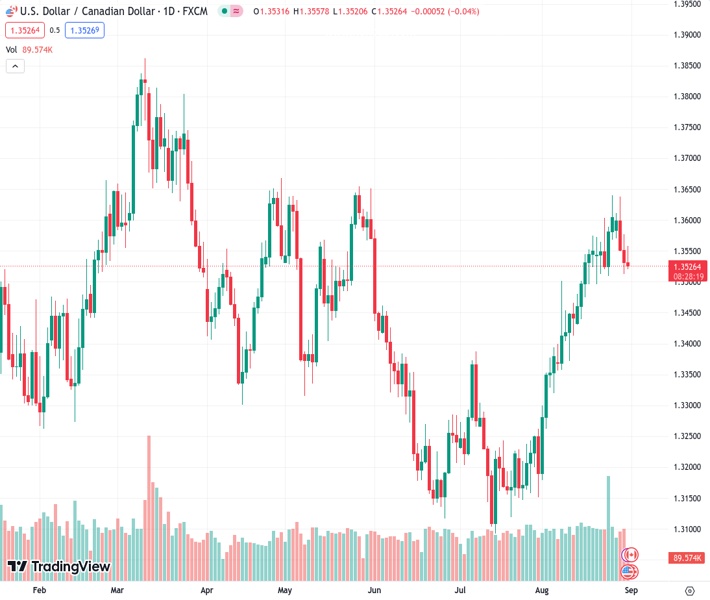
The USDCAD pair is currently at 1.35300 and is expected to find support around 1.3520. At the same time, the US Dollar is experiencing a quick rebound.
…
This is a premium post.
[s2If !current_user_can(access_s2member_level4)]Please register for FREE REGISTER to read full post below containing analysis. In case of any error or you think you are not able to read the full post below, please email us at support#nehcap.com [lwa][/s2If] [s2If current_user_can(access_s2member_level1)]
- USD/CAD gauges support near 1.3520 while the US Dollar’s recovery remains swift.
The pair currently trades last at 1.35300.
The previous day high was 1.3577 while the previous day low was 1.3513. The daily 38.2% Fib levels comes at 1.3537, expected to provide resistance. Similarly, the daily 61.8% fib level is at 1.3553, expected to provide resistance.
The USD/CAD pair found a cushion near 1.3520 and defended its psychological support of 1.3500 after a recovery move in the US Dollar. The Loonie asset delivered a nominal recovery while the pace of rebound in the US Dollar Index (DXY) was higher. The rebound move in the Lonnie asset remained modest as the Canadian Dollar strengthened due to a rally in oil prices.
S&P500 futures remain lackluster in Europe as investors await Personal Consumption Expenditure (PCE) price index data for July.
Analysts at CMC markets said July inflation numbers could prompt further concern about sticky inflation on the recording of sizeable ticks higher in the monthly as well as annual headline numbers. August CPI numbers were evidence that prices might struggle to move much lower after headline CPI edged higher to 3.2%. Investors can see a similar move in this week’s numbers, with a move to 3.3% in the deflator and to 4.3% in the core deflator.”
The US Dollar Index recovered swiftly to near 103.60 after discovering the 103.00 figure as a crucial support. After the Fed’s preferred inflation tool, investors will focus on the Nonfarm Payrolls (NFP) data, which will be published on Friday. Scrutiny of the US ADP Employment Change report indicates that fresh payrolls were weaker than anticipated and wage growth remained slowest since October 2021.
The oil price rallied above $82.00 on Thursday as the oil market is expected to tighten further. Bloomberg reported that Saudi Arabia is expected to extend a million-barrel oil supply cut into October, as it seeks to shore up prices against a faltering economic backdrop.
It is worth noting that Canada is the leading exporter of oil to the United States and higher oil prices strengthen the Canadian Dollar.
The Canadian Dollar will remain in action on Friday amid the release of Q2 Gross Domestic Product (GDP) data. Investors hope that the April-June quarter expanded at a 0.3% pace, slower than Q1’s growth rate of 0.8%.
Technical Levels: Supports and Resistances
USDCAD currently trading at 1.3538 at the time of writing. Pair opened at 1.3532 and is trading with a change of 0.04 % .
| Overview | Overview.1 | |
|---|---|---|
| 0 | Today last price | 1.3538 |
| 1 | Today Daily Change | 0.0006 |
| 2 | Today Daily Change % | 0.0400 |
| 3 | Today daily open | 1.3532 |
The pair remains strongly bullish on the daily timeframe. It trades above its 20 SMA @ 1.3495, 50 SMA 1.3331, 100 SMA @ 1.3392 and 200 SMA @ 1.3462.
| Trends | Trends.1 | |
|---|---|---|
| 0 | Daily SMA20 | 1.3495 |
| 1 | Daily SMA50 | 1.3331 |
| 2 | Daily SMA100 | 1.3392 |
| 3 | Daily SMA200 | 1.3462 |
The previous day high was 1.3577 while the previous day low was 1.3513. The daily 38.2% Fib levels comes at 1.3537, expected to provide resistance. Similarly, the daily 61.8% fib level is at 1.3553, expected to provide resistance.
Note the levels of interest below:
- Pivot support is noted at 1.3505, 1.3477, 1.3441
- Pivot resistance is noted at 1.3569, 1.3605, 1.3632
| Levels | Levels.1 |
|---|---|
| Previous Daily High | 1.3577 |
| Previous Daily Low | 1.3513 |
| Previous Weekly High | 1.3640 |
| Previous Weekly Low | 1.3496 |
| Previous Monthly High | 1.3387 |
| Previous Monthly Low | 1.3093 |
| Daily Fibonacci 38.2% | 1.3537 |
| Daily Fibonacci 61.8% | 1.3553 |
| Daily Pivot Point S1 | 1.3505 |
| Daily Pivot Point S2 | 1.3477 |
| Daily Pivot Point S3 | 1.3441 |
| Daily Pivot Point R1 | 1.3569 |
| Daily Pivot Point R2 | 1.3605 |
| Daily Pivot Point R3 | 1.3632 |
[/s2If]
Download Nehcap EAWe have two EAs that are operational on our LIVE accounts.
- EA-FIX: Check out the details here. Download EA-FIX . EA-FIX is a non-grid HFT scalper.
- EA-GROWTH: High quality low dd EA using trend grids. Download EA_GROWTHJoin Our Telegram Group


