The Australian dollar to US dollar exchange rate increased at 0.64700 as a result of positive economic data from Australia.
…
This is a premium post.
[s2If !current_user_can(access_s2member_level4)]Please register for FREE REGISTER to read full post below containing analysis. In case of any error or you think you are not able to read the full post below, please email us at support#nehcap.com [lwa][/s2If] [s2If current_user_can(access_s2member_level1)]
- AUD/USD experienced gains due to Australia’s upbeat macroeconomic data.
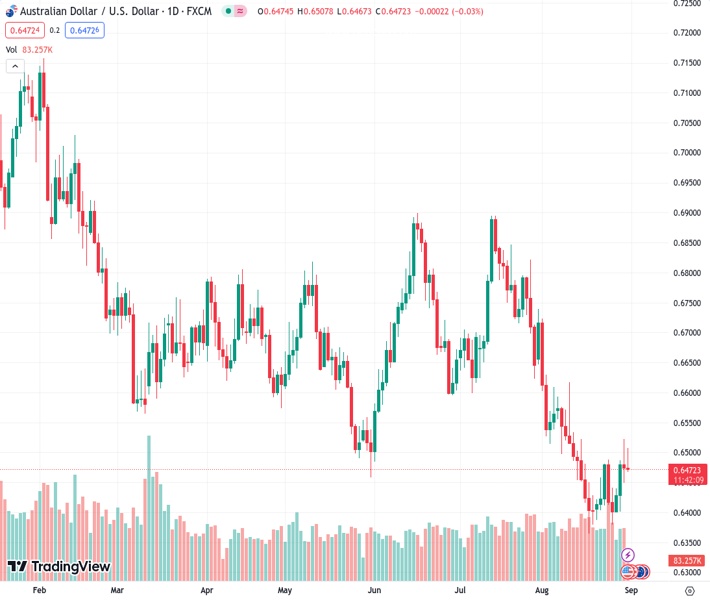
The pair currently trades last at 0.64700.
The previous day high was 0.6522 while the previous day low was 0.6449. The daily 38.2% Fib levels comes at 0.6477, expected to provide resistance. Similarly, the daily 61.8% fib level is at 0.6494, expected to provide resistance.
AUD/USD trades sideways around 0.6470 at the time of writing during the European session on Thursday. The pair experienced upward support due to Australia’s upbeat Private Capital Expenditure for the second quarter and China’s moderate economic data released on Thursday, contributing additional support to the AUD/USD pair. As said, the data reported that Australia’s capital expenditure intentions rose to 2.8%, against the expected 1.2% figure and 2.4% prior.
Additionally, China’s August NBS Manufacturing PMI data showed an improvement. The report printed a reading of 49.7 compared to the market consensus of 49.24 figure and 49.3 previously. While Non-Manufacturing PMI fell to 51.0, worse than the expected 51.1 figure. The index reported a reading of 51.5 in July.
US Dollar Index (DXY), which measures the performance of the US Dollar (USD) against the six other major currencies, trades higher around 103.40 at the time of writing. The Greenback experienced downward pressure due to the slew of disappointing US economic data and a pullback in US Treasury yields. The yield on a 10-year US bond extends its losses. Spot price trades at 4.10%, continuing a downward trajectory for the fourth consecutive day.
As mentioned, the US ADP National Employment reported a sharp decline in the number of jobs generated in August. The data showed 177K new jobs added to the economy compared to the 371K jobs that were generated in July. The market was expecting 195K new jobs to be added. Moreover, the preliminary Gross Domestic Product (GDP) reported a figure of 2.1% against the expected reading of 2.4%.
Investors will likely monitor the upcoming data from the US scheduled to be released on Thursday, seeking further cues on the inflation outlook in the country. These datasets include the Core Personal Consumption Expenditures (PCE) – Price Index (MoM), and Initial Jobless Claims (Aug 25). Along with, Average Hourly Earnings (MoM) and Nonfarm Payrolls (Aug) will be released on Friday.
Technical Levels: Supports and Resistances
AUDUSD currently trading at 0.6474 at the time of writing. Pair opened at 0.6475 and is trading with a change of -0.02 % .
| Overview | Overview.1 | |
|---|---|---|
| 0 | Today last price | 0.6474 |
| 1 | Today Daily Change | -0.0001 |
| 2 | Today Daily Change % | -0.0200 |
| 3 | Today daily open | 0.6475 |
The pair remains strongly bearish on the daily time frame. It trades below the 20 SMA @ 0.6474, 50 SMA 0.6616, 100 SMA @ 0.6649 and 200 SMA @ 0.6724.
| Trends | Trends.1 | |
|---|---|---|
| 0 | Daily SMA20 | 0.6474 |
| 1 | Daily SMA50 | 0.6616 |
| 2 | Daily SMA100 | 0.6649 |
| 3 | Daily SMA200 | 0.6724 |
The previous day high was 0.6522 while the previous day low was 0.6449. The daily 38.2% Fib levels comes at 0.6477, expected to provide resistance. Similarly, the daily 61.8% fib level is at 0.6494, expected to provide resistance.
Note the levels of interest below:
- Pivot support is noted at 0.6442, 0.6409, 0.6369
- Pivot resistance is noted at 0.6515, 0.6555, 0.6588
| Levels | Levels.1 |
|---|---|
| Previous Daily High | 0.6522 |
| Previous Daily Low | 0.6449 |
| Previous Weekly High | 0.6488 |
| Previous Weekly Low | 0.6380 |
| Previous Monthly High | 0.6895 |
| Previous Monthly Low | 0.6599 |
| Daily Fibonacci 38.2% | 0.6477 |
| Daily Fibonacci 61.8% | 0.6494 |
| Daily Pivot Point S1 | 0.6442 |
| Daily Pivot Point S2 | 0.6409 |
| Daily Pivot Point S3 | 0.6369 |
| Daily Pivot Point R1 | 0.6515 |
| Daily Pivot Point R2 | 0.6555 |
| Daily Pivot Point R3 | 0.6588 |
[/s2If]
Download Nehcap EAWe have two EAs that are operational on our LIVE accounts.
- EA-FIX: Check out the details here. Download EA-FIX . EA-FIX is a non-grid HFT scalper.
- EA-GROWTH: High quality low dd EA using trend grids. Download EA_GROWTHJoin Our Telegram Group


