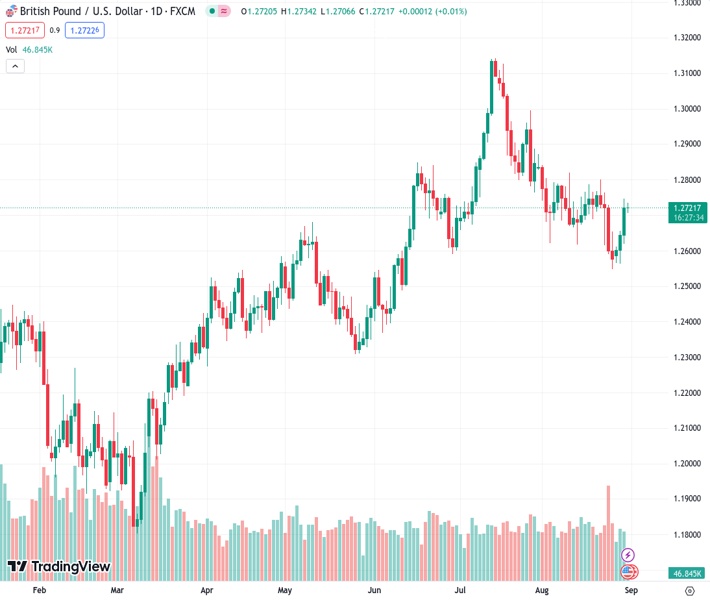
The GBPUSD currency pair, currently valued at 1.27212, is fluctuating within a small range slightly below its one-week high reached on Wednesday.
…
This is a premium post.
[s2If !current_user_can(access_s2member_level4)]Please register for FREE REGISTER to read full post below containing analysis. In case of any error or you think you are not able to read the full post below, please email us at support#nehcap.com [lwa][/s2If] [s2If current_user_can(access_s2member_level1)]
- GBP/USD oscillates in a narrow band just below a one-week high touched on Wednesday.
The pair currently trades last at 1.27212.
The previous day high was 1.2746 while the previous day low was 1.2619. The daily 38.2% Fib levels comes at 1.2698, expected to provide support. Similarly, the daily 61.8% fib level is at 1.2668, expected to provide support.
The GBP/USD pair consolidates its weekly gains registered over the past three days and seesaws between tepid gains/minor losses through the Asian session on Thursday. Spot prices currently trade around the 1.2720 region, nearly unchanged for the day and just a few pips below a one-week high touched on Wednesday.
The US Dollar (USD) finds some support near a technically significant 200-day Simple Moving Average (SMA) and for now, seems to have stalled its recent pullback from the highest level since early June. This, in turn, is seen as a key factor acting as a headwind for the GBP/USD pair, though the prospects for further interest rate hikes by the Bank of England (BoE) might continue to lend support to the British Pound and warrant caution for bearish traders.
In fact, BoE Deputy Governor Ben Broadbent, speaking at the Jackson Hole Symposium on Saturday, said that policy rates may well have to remain in restrictive territory for some time as the knock-on effects of the surge in prices were unlikely to fade away rapidly. Apart from this, expectations that the Federal Reserve (Fed) will pause its rate-hiking cycle in September might cap the USD and contribute to limiting the downside for the GBP/USD pair.
Investors now seem convinced that the US central bank will soften its hawkish stance and the bets were lifted by the disappointing US macro data released on Wednesday. The ADP report showed that the US private-sector employers added 177K jobs in August, much lower than the previous month’s downwardly revised reading of 324K. Moreover, the US Q2 GDP growth rate was also lowered to a 2.1% annualized pace from the 2.4% estimated orignally.
The aforementioned fundamental backdrop suggests that the path of least resistance for the GBP/USD pair is to the upside, though traders seem reluctant and look to a scheduled speech by BoE Chief Economist Huw Pill. Later during the early North American session, the release of the US Core PCE Price Index – the Fed’s preferred inflation gauge – will influence the USD price dynamics and allow traders to grab short-term opportunities around the pair.
Technical Levels: Supports and Resistances
GBPUSD currently trading at 1.2723 at the time of writing. Pair opened at 1.2721 and is trading with a change of 0.02 % .
| Overview | Overview.1 | |
|---|---|---|
| 0 | Today last price | 1.2723 |
| 1 | Today Daily Change | 0.0002 |
| 2 | Today Daily Change % | 0.0200 |
| 3 | Today daily open | 1.2721 |
The pair is trading above its 20 Daily moving average @ 1.2702, below its 50 Daily moving average @ 1.2781 , above its 100 Daily moving average @ 1.2647 and above its 200 Daily moving average @ 1.2411
| Trends | Trends.1 | |
|---|---|---|
| 0 | Daily SMA20 | 1.2702 |
| 1 | Daily SMA50 | 1.2781 |
| 2 | Daily SMA100 | 1.2647 |
| 3 | Daily SMA200 | 1.2411 |
The previous day high was 1.2746 while the previous day low was 1.2619. The daily 38.2% Fib levels comes at 1.2698, expected to provide support. Similarly, the daily 61.8% fib level is at 1.2668, expected to provide support.
Note the levels of interest below:
- Pivot support is noted at 1.2645, 1.2568, 1.2517
- Pivot resistance is noted at 1.2772, 1.2823, 1.29
| Levels | Levels.1 |
|---|---|
| Previous Daily High | 1.2746 |
| Previous Daily Low | 1.2619 |
| Previous Weekly High | 1.2800 |
| Previous Weekly Low | 1.2548 |
| Previous Monthly High | 1.3142 |
| Previous Monthly Low | 1.2659 |
| Daily Fibonacci 38.2% | 1.2698 |
| Daily Fibonacci 61.8% | 1.2668 |
| Daily Pivot Point S1 | 1.2645 |
| Daily Pivot Point S2 | 1.2568 |
| Daily Pivot Point S3 | 1.2517 |
| Daily Pivot Point R1 | 1.2772 |
| Daily Pivot Point R2 | 1.2823 |
| Daily Pivot Point R3 | 1.2900 |
[/s2If]
Download Nehcap EAWe have two EAs that are operational on our LIVE accounts.
- EA-FIX: Check out the details here. Download EA-FIX . EA-FIX is a non-grid HFT scalper.
- EA-GROWTH: High quality low dd EA using trend grids. Download EA_GROWTHJoin Our Telegram Group


