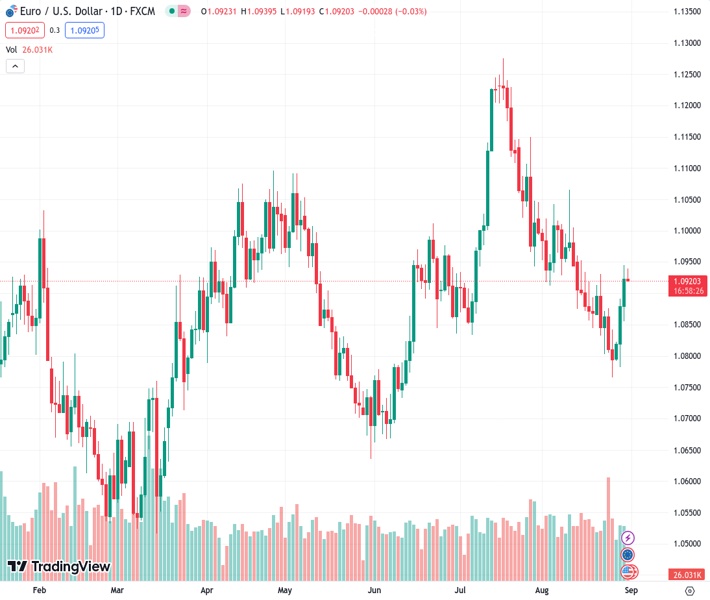
The EURUSD currency pair, currently trading at 1.09190, is maintaining its recent gains and staying above a two-week high reached on Wednesday.
…
This is a premium post.
[s2If !current_user_can(access_s2member_level4)]Please register for FREE REGISTER to read full post below containing analysis. In case of any error or you think you are not able to read the full post below, please email us at support#nehcap.com [lwa][/s2If] [s2If current_user_can(access_s2member_level1)]
- EUR/USD consolidates its recent gains to over a two-week high touched on Wednesday.
The pair currently trades last at 1.09190.
The previous day high was 1.0946 while the previous day low was 1.0855. The daily 38.2% Fib levels comes at 1.0911, expected to provide support. Similarly, the daily 61.8% fib level is at 1.089, expected to provide support.
The EUR/USD pair oscillates in a narrow trading band through the Asian session on Thursday and consolidates its recent gains to a two-and-half-week high touched the previous day. Spot prices currently trade below mid-1.0900s and remain at the mercy of the US Dollar (USD) price dynamics.
The USD Index (DXY), which tracks the Greenback against a basket of currencies, finds some support near the very important 200-day Simple Moving Average (SMA) and for now, seems to have stalled its recent pullback from a nearly three-month high. This, in turn, is seen as a key factor acting as a tailwind for the EUR/USD pair, though expectations that the Federal Reserve (Fed) will pause its rate-hiking cycle should keep a lid on any meaningful upside for the buck and help limit the downside.
Investors now seem convinced that the US central bank will soften its hawkish stance and the bets were lifted by the disappointing US macro data released on Wednesday. In fact, the ADP reported that the US private-sector employers added 177K jobs in August, much lower than the previous month’s downwardly revised reading of 324K. Adding to this, the second estimate showed that the US economy grew by 2.1% annualized pace in the second quarter as compared to the 2.4% original readout.
The shared currency, on the other hand, might continue to draw support from reviving bets for more interest rate hikes by the European Central Bank (ECB). The bets were lifted by the latest consumer inflation figures from Germany on Wednesday, which showed that the annual Harmonised Index of Consumer Prices (HICP) rose 6.4% in August as compared to 6.2% expected. Adding to this, the core inflation rate, which excludes volatile items such as food and energy, remained unchanged from July.
The aforementioned fundamental backdrop supports prospects for the emergence of some dip-buying around the EUR/USD pair and warrants some caution before confirming that the recent bounce from the lowest level since June 13 has run out of steam. Market participants now look forward to the US economic docket, featuring the release of the Core PCE Price Index – the Fed’s preferred inflation gauge – and the Weekly Initial Jobless Claims, later during the early North American session.
The data, along with the US bond yields and the broader risk sentiment, will drive the USD demand and provide some impetus to the EUR/USD pair. The focus, however, will remain glued to closely-watched US monthly employment details, popularly known as the NFP report on Friday.
Technical Levels: Supports and Resistances
EURUSD currently trading at 1.0922 at the time of writing. Pair opened at 1.0924 and is trading with a change of -0.02 % .
| Overview | Overview.1 | |
|---|---|---|
| 0 | Today last price | 1.0922 |
| 1 | Today Daily Change | -0.0002 |
| 2 | Today Daily Change % | -0.0200 |
| 3 | Today daily open | 1.0924 |
The pair is trading above its 20 Daily moving average @ 1.0904, below its 50 Daily moving average @ 1.0973 , below its 100 Daily moving average @ 1.0926 and above its 200 Daily moving average @ 1.0812
| Trends | Trends.1 | |
|---|---|---|
| 0 | Daily SMA20 | 1.0904 |
| 1 | Daily SMA50 | 1.0973 |
| 2 | Daily SMA100 | 1.0926 |
| 3 | Daily SMA200 | 1.0812 |
The previous day high was 1.0946 while the previous day low was 1.0855. The daily 38.2% Fib levels comes at 1.0911, expected to provide support. Similarly, the daily 61.8% fib level is at 1.089, expected to provide support.
Note the levels of interest below:
- Pivot support is noted at 1.0871, 1.0818, 1.078
- Pivot resistance is noted at 1.0961, 1.0998, 1.1051
| Levels | Levels.1 |
|---|---|
| Previous Daily High | 1.0946 |
| Previous Daily Low | 1.0855 |
| Previous Weekly High | 1.0930 |
| Previous Weekly Low | 1.0766 |
| Previous Monthly High | 1.1276 |
| Previous Monthly Low | 1.0834 |
| Daily Fibonacci 38.2% | 1.0911 |
| Daily Fibonacci 61.8% | 1.0890 |
| Daily Pivot Point S1 | 1.0871 |
| Daily Pivot Point S2 | 1.0818 |
| Daily Pivot Point S3 | 1.0780 |
| Daily Pivot Point R1 | 1.0961 |
| Daily Pivot Point R2 | 1.0998 |
| Daily Pivot Point R3 | 1.1051 |
[/s2If]
Download Nehcap EAWe have two EAs that are operational on our LIVE accounts.
- EA-FIX: Check out the details here. Download EA-FIX . EA-FIX is a non-grid HFT scalper.
- EA-GROWTH: High quality low dd EA using trend grids. Download EA_GROWTHJoin Our Telegram Group


