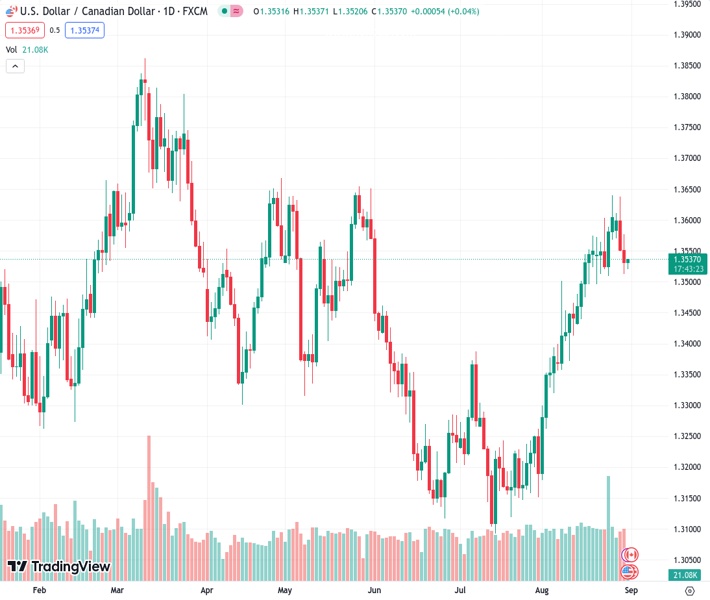
The USDCAD pair, at a rate of 1.35359, rebounds from its lowest point of the week and causes a three-day period of consecutive losses.
…
This is a premium post.
[s2If !current_user_can(access_s2member_level4)]Please register for FREE REGISTER to read full post below containing analysis. In case of any error or you think you are not able to read the full post below, please email us at support#nehcap.com [lwa][/s2If] [s2If current_user_can(access_s2member_level1)]
- USD/CAD bounces off weekly low to prod three-day losing streak.
The pair currently trades last at 1.35359.
The previous day high was 1.3577 while the previous day low was 1.3513. The daily 38.2% Fib levels comes at 1.3537, expected to provide resistance. Similarly, the daily 61.8% fib level is at 1.3553, expected to provide resistance.
USD/CAD picks up bids to extend the early Asian session rebound from the weekly low as markets brace for Thursday’s top-tier US inflation clues. Even so, the Loonie pair buyers lack confidence around 1.3535 by the press time. Apart from the pre-data consolidation, a pullback in Canada’s main export item, namely WTI crude oil also puts a floor under the prices after a three-day losing streak.
That said, the WTI crude oil reverses from a two-week high while snapping a two-day winning streak with mild losses near $81.30. In doing so, the black gold fails to cheer the price-positive weekly inventory from the US, as well as the softer US Dollar, amid mixed China PMI data and stimulus updates.
Earlier in the day, China’s official NBS Manufacturing PMI for August rose to 49.7 versus 49.4 expected and 49.3 previous readings whereas the Non-Manufacturing PMI came in as 51.0 compared to 51.5 prior and market forecasts of 51.1. Following that, People’s Bank of China (PBOC) announced on Thursday that it “will continue to step up loans to private companies,” in other efforts to boost the private sector economy.
On the other hand, the US Dollar Index (DXY) remains pressured at 103.10, poking the 200-DMA support while struggling to defend the previous three-day losing streak, as traders seek more clues to confirm the dovish bias about the US Federal Reserve.
The disappointment from initial signals of Friday’s Nonfarm Payrolls (NFP) also lured the USD/JPY bears as the ADP Employment Change dropped to 177K compared to 195K market forecasts and 371K previous readings (revised from 324K). On the same line, the second readings of the US second quarter (Q2) Gross Domestic Product (GDP) Annualized declined to 2.1% from 2.4% initial forecasts while the GDP Price Index also eased to 2.0% versus the first readings of 2.2%. Further, the preliminary readings of the Personal Consumption Expenditures (PCE) Prices also edged lower to 2.5% from 2.6% prior estimations for the said period. Previously, the US Consumer Confidence and activity data, as well as the housing market numbers, favored dovish calls about the US central bank and weighed on the US Dollar.
Against this backdrop, the S&P 500 Futures struggle to track Wall Street’s gains amid a cautious mood ahead of the key US data. However, the benchmark US 10-year Treasury bond yields remain pressured at the lowest levels in three weeks, around 4.11% by the press time.
Looking ahead, the Fed’s preferred inflation gauge, namely the US Core Personal Consumption Expenditure (PCE) Price Index for August, expected to remain unchanged at 0.2% MoM but edge higher to 4.2% YoY from 4.1% prior, will be important for clear directions. Additionally, Canada Current Account Balance and the mid-tier US data about employment and manufacturing activity will also be important to watch for clear directions.
USD/CAD rebound appears elusive unless it provides a daily closing beyond the 10-DMA hurdle of around 1.3560.
Technical Levels: Supports and Resistances
USDCAD currently trading at 1.3535 at the time of writing. Pair opened at 1.3532 and is trading with a change of 0.02% % .
| Overview | Overview.1 | |
|---|---|---|
| 0 | Today last price | 1.3535 |
| 1 | Today Daily Change | 0.0003 |
| 2 | Today Daily Change % | 0.02% |
| 3 | Today daily open | 1.3532 |
The pair remains strongly bullish on the daily timeframe. It trades above its 20 SMA @ 1.3495, 50 SMA 1.3331, 100 SMA @ 1.3392 and 200 SMA @ 1.3462.
| Trends | Trends.1 | |
|---|---|---|
| 0 | Daily SMA20 | 1.3495 |
| 1 | Daily SMA50 | 1.3331 |
| 2 | Daily SMA100 | 1.3392 |
| 3 | Daily SMA200 | 1.3462 |
The previous day high was 1.3577 while the previous day low was 1.3513. The daily 38.2% Fib levels comes at 1.3537, expected to provide resistance. Similarly, the daily 61.8% fib level is at 1.3553, expected to provide resistance.
Note the levels of interest below:
- Pivot support is noted at 1.3505, 1.3477, 1.3441
- Pivot resistance is noted at 1.3569, 1.3605, 1.3632
| Levels | Levels.1 |
|---|---|
| Previous Daily High | 1.3577 |
| Previous Daily Low | 1.3513 |
| Previous Weekly High | 1.3640 |
| Previous Weekly Low | 1.3496 |
| Previous Monthly High | 1.3387 |
| Previous Monthly Low | 1.3093 |
| Daily Fibonacci 38.2% | 1.3537 |
| Daily Fibonacci 61.8% | 1.3553 |
| Daily Pivot Point S1 | 1.3505 |
| Daily Pivot Point S2 | 1.3477 |
| Daily Pivot Point S3 | 1.3441 |
| Daily Pivot Point R1 | 1.3569 |
| Daily Pivot Point R2 | 1.3605 |
| Daily Pivot Point R3 | 1.3632 |
[/s2If]
Download Nehcap EAWe have two EAs that are operational on our LIVE accounts.
- EA-FIX: Check out the details here. Download EA-FIX . EA-FIX is a non-grid HFT scalper.
- EA-GROWTH: High quality low dd EA using trend grids. Download EA_GROWTHJoin Our Telegram Group


