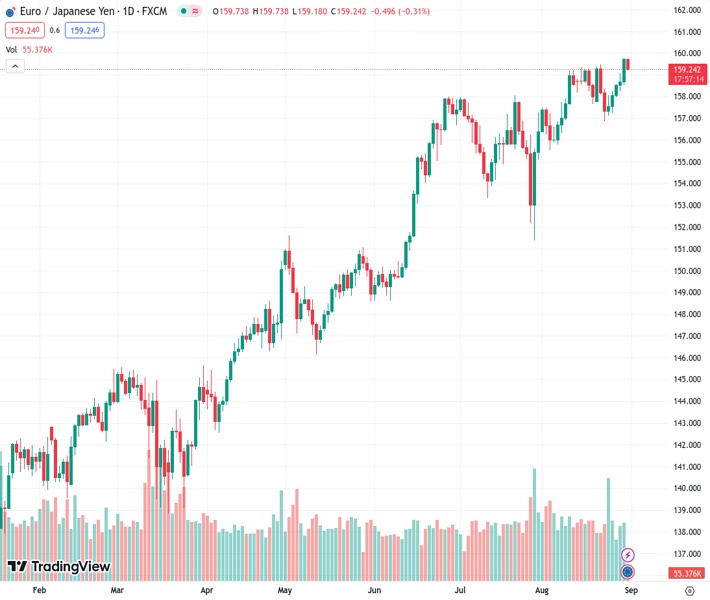
EURJPY is currently trading at 159.245 and is encountering selling pressure, causing it to retreat from its highest level in several years. However, Nehcap believes that the potential decline in value will be minimal.
…
This is a premium post.
[s2If !current_user_can(access_s2member_level4)]Please register for FREE REGISTER to read full post below containing analysis. In case of any error or you think you are not able to read the full post below, please email us at support#nehcap.com [lwa][/s2If] [s2If current_user_can(access_s2member_level1)]
- EUR/JPY takes offers to refresh intraday high while reversing from multi-year high.
The pair currently trades last at 159.245.
The previous day high was 159.76 while the previous day low was 158.45. The daily 38.2% Fib levels comes at 159.26, expected to provide resistance. Similarly, the daily 61.8% fib level is at 158.95, expected to provide support.
EUR/JPY reveres from the highest level since 2008 as it braces for the Eurozone inflation data for August during early Thursday. In doing so, the cross-currency pair takes a U-turn from a nine-week-long rising resistance line while refreshing the intraday low to 159.30 by the press time.
That said, the first readings of the Eurozone Consumer Price Index (CPI) for August will join the European Central Bank’s (ECB) favorite inflation gauge, namely the Harmonized Index of Consumer Prices (HICP), to direct intraday moves. Given the recent challenges for the global central bankers, a surprise positive in the inflation numbers may allow the EUR/JPY to refresh the multi-year high.
It’s worth noting that the sluggish MACD signals raise doubts about the pair’s further upside and hence downbeat outcomes from the inflation cues won’t hesitate to drag the quote toward the 158.50 support confluence including the 10-DMA and an ascending support line from late July.
However, the RSI (14) appears firmer, not overbought, which in turn joins the Bank of Japan’s (BoJ) dovish bias to put a floor under the EUR/JPY prices near 158.50, a break of which will challenge the previous weekly high of around 156.85.
Above all, the pair buyers remain hopeful unless they witness a clear downside break of a four-month-old rising support line, close to 153.70 at the latest.
On the flip side, the EUR/JPY pair’s recovery needs validation from the aforementioned nine-week-old rising resistance line, close to the 159.80 level, as well as the 160.00 threshold.
Following that, the June 2008 low of around 161.75 will be in the spotlight.
Trend: Limited downside expected
Technical Levels: Supports and Resistances
EURJPY currently trading at 159.28 at the time of writing. Pair opened at 159.75 and is trading with a change of -0.29% % .
| Overview | Overview.1 | |
|---|---|---|
| 0 | Today last price | 159.28 |
| 1 | Today Daily Change | -0.47 |
| 2 | Today Daily Change % | -0.29% |
| 3 | Today daily open | 159.75 |
The pair remains strongly bullish on the daily timeframe. It trades above its 20 SMA @ 158.12, 50 SMA 157.03, 100 SMA @ 153.25 and 200 SMA @ 147.88.
| Trends | Trends.1 | |
|---|---|---|
| 0 | Daily SMA20 | 158.12 |
| 1 | Daily SMA50 | 157.03 |
| 2 | Daily SMA100 | 153.25 |
| 3 | Daily SMA200 | 147.88 |
The previous day high was 159.76 while the previous day low was 158.45. The daily 38.2% Fib levels comes at 159.26, expected to provide resistance. Similarly, the daily 61.8% fib level is at 158.95, expected to provide support.
Note the levels of interest below:
- Pivot support is noted at 158.88, 158.01, 157.57
- Pivot resistance is noted at 160.19, 160.63, 161.5
| Levels | Levels.1 |
|---|---|
| Previous Daily High | 159.76 |
| Previous Daily Low | 158.45 |
| Previous Weekly High | 159.49 |
| Previous Weekly Low | 156.87 |
| Previous Monthly High | 158.05 |
| Previous Monthly Low | 151.41 |
| Daily Fibonacci 38.2% | 159.26 |
| Daily Fibonacci 61.8% | 158.95 |
| Daily Pivot Point S1 | 158.88 |
| Daily Pivot Point S2 | 158.01 |
| Daily Pivot Point S3 | 157.57 |
| Daily Pivot Point R1 | 160.19 |
| Daily Pivot Point R2 | 160.63 |
| Daily Pivot Point R3 | 161.50 |
[/s2If]
Download Nehcap EAWe have two EAs that are operational on our LIVE accounts.
- EA-FIX: Check out the details here. Download EA-FIX . EA-FIX is a non-grid HFT scalper.
- EA-GROWTH: High quality low dd EA using trend grids. Download EA_GROWTHJoin Our Telegram Group


