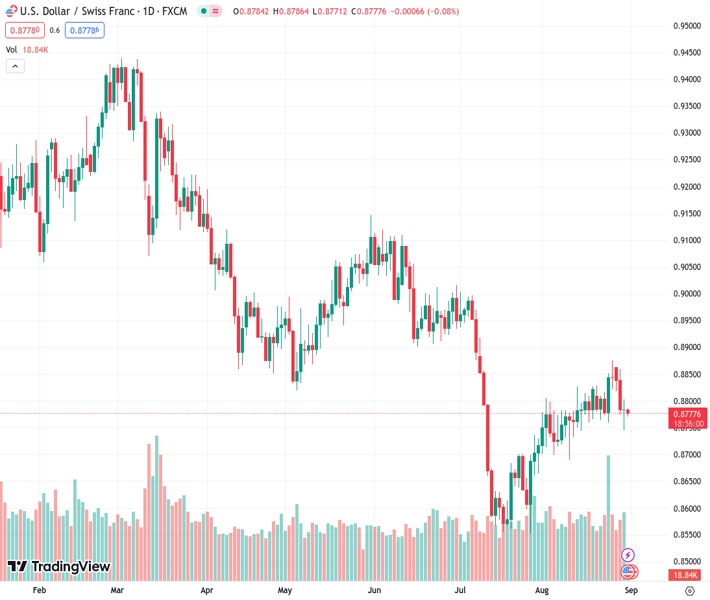
The currency pair USDCHF, trading at 0.87771, experiences a decrease in momentum and fails to surpass the 0.8800 level on Thursday.
…
This is a premium post.
[s2If !current_user_can(access_s2member_level4)]Please register for FREE REGISTER to read full post below containing analysis. In case of any error or you think you are not able to read the full post below, please email us at support#nehcap.com [lwa][/s2If] [s2If current_user_can(access_s2member_level1)]
- USD/CHF loses steam below the 0.8800 barrier on Thursday.
The pair currently trades last at 0.87771.
The previous day high was 0.8804 while the previous day low was 0.8745. The daily 38.2% Fib levels comes at 0.8781, expected to provide resistance. Similarly, the daily 61.8% fib level is at 0.8767, expected to provide support.
The USD/CHF pair loses its recovery momentum and holds below the 0.8800 mark during the early Asian trading hours on Thursday. Meanwhile, the US Dollar Index (DXY), a measure of the value of USD against six other major currencies, loses momentum and hovers around 103.00. At the time of writing, the USD/CHF is trading at 0.8772, losing 0.14%.
Automatic Data Processing, Inc. reported on Wednesday that the US ADP Employment Change dropped to 177K in August from 371K in July and came in below the market expectation of 195K. Additionally, the first estimate of Personal Consumption Expenditures (PCE) Prices in Q2 fell to 2.5% versus 2.6% prior. Finally, the second estimate of Gross Domestic Product (GDP) Annualised Q2 decreased to 2.1% from the first estimation of 2.4%.
According to the CME FedWatch tool, markets are now pricing near 40% a rate hike in November and will cut the rate in June 2024. Markets anticipate that the Federal Reserve (Fed) will end its tightened policy sooner than expected, even though Federal Reserve (Fed) Chairman Jerome Powell stated a potential additional rate hike would depend on incoming data. The condition of the labor market may influence the USD’s short-term direction. Market participants are awaiting the release of US employment data later this week, which could spark market volatility.
On the Swiss franc front, the weaker-than-expected Swiss data capped the upside CHF against the US Dollar. On Wednesday, the KOF Leading Indicator for August came in at 91.1 versus 92.01 prior and below the market consensus of 91.5. Meanwhile, the ZEW Survey of Expectation for the same period fell to -38.6 from -32.6 the previous month and missed the expectation of -31.3.
Apart from the data, the concern about China’s economic woes might benefit the traditional safe-haven Swiss Franc. Country Garden, the largest private real estate developer in China, issued a default warning on Wednesday if its financial performance continues to deteriorate, according to Reuters.
Market participants will monitor the US Core Personal Consumption Expenditure Price Index (PCE), the weekly Jobless Claims, and the Chicago PMI due later on Thursday. The attention will shift to the annual Swiss Consumer Price Index (CPI) and highly-anticipated US Nonfarm Payrolls on Friday. These figures might trigger the volatility in the market and traders will find the trading opportunities around the USD/CHF pair.
Technical Levels: Supports and Resistances
USDCHF currently trading at 0.8776 at the time of writing. Pair opened at 0.8785 and is trading with a change of -0.1 % .
| Overview | Overview.1 | |
|---|---|---|
| 0 | Today last price | 0.8776 |
| 1 | Today Daily Change | -0.0009 |
| 2 | Today Daily Change % | -0.1000 |
| 3 | Today daily open | 0.8785 |
The pair remains strongly bearish on the daily time frame. It trades below the 20 SMA @ 0.8785, 50 SMA 0.8788, 100 SMA @ 0.8883 and 200 SMA @ 0.9073.
| Trends | Trends.1 | |
|---|---|---|
| 0 | Daily SMA20 | 0.8785 |
| 1 | Daily SMA50 | 0.8788 |
| 2 | Daily SMA100 | 0.8883 |
| 3 | Daily SMA200 | 0.9073 |
The previous day high was 0.8804 while the previous day low was 0.8745. The daily 38.2% Fib levels comes at 0.8781, expected to provide resistance. Similarly, the daily 61.8% fib level is at 0.8767, expected to provide support.
Note the levels of interest below:
- Pivot support is noted at 0.8752, 0.8719, 0.8693
- Pivot resistance is noted at 0.8811, 0.8836, 0.8869
| Levels | Levels.1 |
|---|---|
| Previous Daily High | 0.8804 |
| Previous Daily Low | 0.8745 |
| Previous Weekly High | 0.8876 |
| Previous Weekly Low | 0.8760 |
| Previous Monthly High | 0.9005 |
| Previous Monthly Low | 0.8552 |
| Daily Fibonacci 38.2% | 0.8781 |
| Daily Fibonacci 61.8% | 0.8767 |
| Daily Pivot Point S1 | 0.8752 |
| Daily Pivot Point S2 | 0.8719 |
| Daily Pivot Point S3 | 0.8693 |
| Daily Pivot Point R1 | 0.8811 |
| Daily Pivot Point R2 | 0.8836 |
| Daily Pivot Point R3 | 0.8869 |
[/s2If]
Download Nehcap EAWe have two EAs that are operational on our LIVE accounts.
- EA-FIX: Check out the details here. Download EA-FIX . EA-FIX is a non-grid HFT scalper.
- EA-GROWTH: High quality low dd EA using trend grids. Download EA_GROWTHJoin Our Telegram Group


