The USDCNH pair is currently experiencing a decline, undoing the gains made yesterday, which were the first in three days. According to @nehcap, it is predicted that there will be further decreases in the future.
…
This is a premium post.
[s2If !current_user_can(access_s2member_level4)]Please register for FREE REGISTER to read full post below containing analysis. In case of any error or you think you are not able to read the full post below, please email us at support#nehcap.com [lwa][/s2If] [s2If current_user_can(access_s2member_level1)]
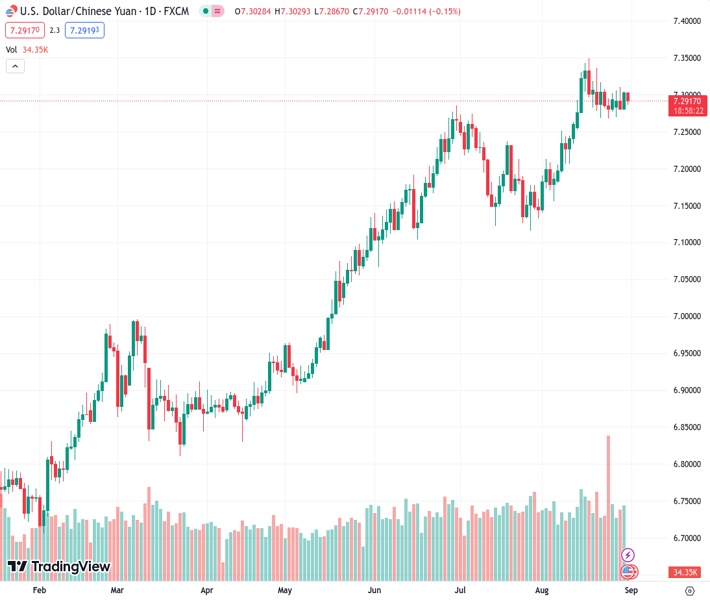
- USD/CNH takes offers to reverse the previous day’s recovery moves, the first in three.
The pair currently trades last at 7.29239.
The previous day high was 7.3046 while the previous day low was 7.2814. The daily 38.2% Fib levels comes at 7.2958, expected to provide resistance. Similarly, the daily 61.8% fib level is at 7.2903, expected to provide support.
USD/CNH reverses the previous daily gains, the first in three, while poking the 7.2880-60 support confluence after China releases monthly activity data on Thursday.
The upbeat prints of China’s official manufacturing gauge contrast with the downbeat non-manufacturing PMI but manage to keep the offshore Chinese Yuan (CNH) buyers hopeful, especially amid the dovish Fed bias and hopes of more stimulus from the Dragon Nation. That said, China’s official NBS Manufacturing PMI for August rose to 49.7 versus 49.4 expected and 49.3 previous readings whereas the Non-Manufacturing PMI came in as 51.0 compared to 51.5 prior and market forecasts of 51.1.
However, a convergence of the 100-SMA and an ascending trend line from August 10, restricts the immediate downside of the USD/CNH pair.
Given the quote’s repeated attempt to break the 100-SMA and the stated support line confluence, around 7.2880-60, coupled with the downbeat US Dollar, the USD/CNH is likely to slip beneath the said key support, which in turn highlights a five-week-long support line of 7.2790.
In a case where the USD/CNH drops below 7.2790, its slump to the August 08 swing high of around 7.2510 and then to the 200-SMA level of near 7.2350 can’t be ruled out.
Meanwhile, the offshore Yuan pair’s recovery remains elusive unless it crosses a one-week-old descending resistance line, close to 7.3050 by the press time.
Following that, 7.3360 may act as an intermediate halt before directing the USD/CNH prices toward the yearly peak of 7.3496.
Trend: Further downside expected
Technical Levels: Supports and Resistances
USDCNH currently trading at 7.2898 at the time of writing. Pair opened at 7.303 and is trading with a change of -0.18% % .
| Overview | Overview.1 | |
|---|---|---|
| 0 | Today last price | 7.2898 |
| 1 | Today Daily Change | -0.0132 |
| 2 | Today Daily Change % | -0.18% |
| 3 | Today daily open | 7.303 |
The pair remains strongly bullish on the daily timeframe. It trades above its 20 SMA @ 7.2715, 50 SMA 7.2307, 100 SMA @ 7.1257 and 200 SMA @ 7.0106.
| Trends | Trends.1 | |
|---|---|---|
| 0 | Daily SMA20 | 7.2715 |
| 1 | Daily SMA50 | 7.2307 |
| 2 | Daily SMA100 | 7.1257 |
| 3 | Daily SMA200 | 7.0106 |
The previous day high was 7.3046 while the previous day low was 7.2814. The daily 38.2% Fib levels comes at 7.2958, expected to provide resistance. Similarly, the daily 61.8% fib level is at 7.2903, expected to provide support.
Note the levels of interest below:
- Pivot support is noted at 7.2881, 7.2732, 7.2649
- Pivot resistance is noted at 7.3113, 7.3196, 7.3345
| Levels | Levels.1 |
|---|---|
| Previous Daily High | 7.3046 |
| Previous Daily Low | 7.2814 |
| Previous Weekly High | 7.3362 |
| Previous Weekly Low | 7.2676 |
| Previous Monthly High | 7.2744 |
| Previous Monthly Low | 7.1160 |
| Daily Fibonacci 38.2% | 7.2958 |
| Daily Fibonacci 61.8% | 7.2903 |
| Daily Pivot Point S1 | 7.2881 |
| Daily Pivot Point S2 | 7.2732 |
| Daily Pivot Point S3 | 7.2649 |
| Daily Pivot Point R1 | 7.3113 |
| Daily Pivot Point R2 | 7.3196 |
| Daily Pivot Point R3 | 7.3345 |
[/s2If]
Download Nehcap EAWe have two EAs that are operational on our LIVE accounts.
- EA-FIX: Check out the details here. Download EA-FIX . EA-FIX is a non-grid HFT scalper.
- EA-GROWTH: High quality low dd EA using trend grids. Download EA_GROWTHJoin Our Telegram Group


