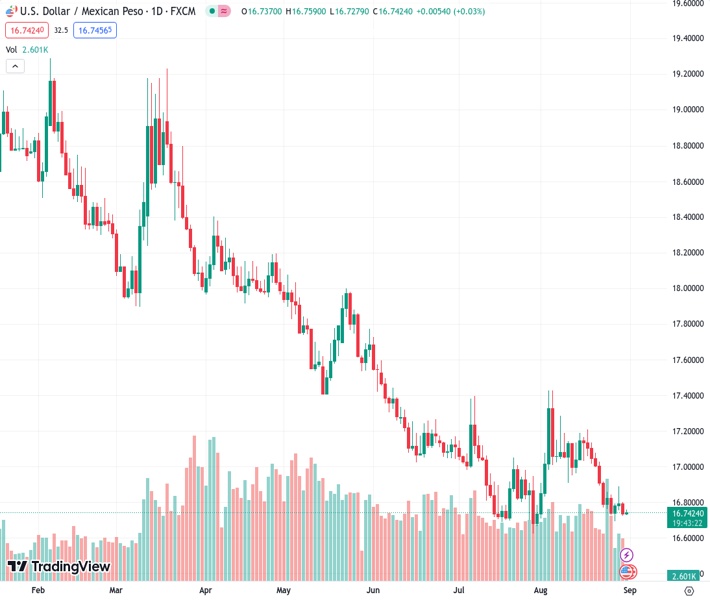
The USDMXN currency pair is facing difficulties in determining its next move as it awaits important data that could provide clarity on its future direction.
…
This is a premium post.
[s2If !current_user_can(access_s2member_level4)]Please register for FREE REGISTER to read full post below containing analysis. In case of any error or you think you are not able to read the full post below, please email us at support#nehcap.com [lwa][/s2If] [s2If current_user_can(access_s2member_level1)]
- USD/MXN struggles for clear directions ahead of key data.
The pair currently trades last at 16.7435.
The previous day high was 16.8036 while the previous day low was 16.7269. The daily 38.2% Fib levels comes at 16.7562, expected to provide resistance. Similarly, the daily 61.8% fib level is at 16.7743, expected to provide resistance.
USD/MXN remains sidelined on the day, as well as on a weekly basis, as it seesaws around 16.72 amid early Thursday, after witnessing downbeat performance the previous day and the last week.
That said, the Mexican Peso (MXN) pair’s latest inaction could be linked to the mixed data from Mexico, as well as the cautious mood ahead of the Fed’s preferred inflation gauge, namely the US Core Personal Consumption Expenditure (PCE) Price Index for August.
Also read: US Dollar Index: DXY drops to 103.00 on Fed policy concerns, US PCE Inflation in focus
Earlier in the week, Mexico’s second quarter (Q2) Gross Domestic Product (GDP) growth eased to 0.8% QoQ versus 0.9% expected and 1.0% prior. However, the nation’s Fiscal Balance in Pesos improved to -77.562B in July from -258.05B in previous readings.
On the other hand, the downside prints of the US statistics bolstered the call of the Federal Reserve’s (Fed) policy pivot and weighed on the US Dollar, as well as the Treasury bond yields. That said, the second readings of the US second quarter (Q2) Gross Domestic Product (GDP) Annualized declined to 2.1% from 2.4% initial forecasts while the GDP Price Index also eased to 2.0% versus the first readings of 2.2%. Further, the preliminary readings of the Personal Consumption Expenditures (PCE) Prices also edged lower to 2.5% from 2.6% prior estimations for the said period. More importantly, the ADP Employment Change dropped to 177K compared to 195K market forecasts and 371K previous readings (revised from 324K).
Earlier in the week, the US consumer sentiment and activity data, as well as the housing market numbers, favored dovish calls about the US central bank and weighed on the US Dollar, as well as the USD/MXN price.
It should be noted that the market’s optimism also weighs on the USD/MXN prices amid hopes of an end to the higher rates. While portraying the mood, the US Dollar Index (DXY) dropped for three consecutive days to the lowest level in two weeks, making rounds to 103.15-10 of late. That said, the benchmark US 10-year Treasury bond yields remain pressured at the lowest levels in three weeks, around 4.11% by the press time whereas the S&P 500 Futures remain indecisive by the press time.
Looking ahead, the US Core PCE Price Index for August, expected to remain unchanged at 0.2% MoM but edge higher to 4.2% YoY from 4.1% prior, will direct the USD/MXN pair moves.
A one-month-old symmetrical triangle restricts USD/MXN moves between 16.70 and 16.85.
Technical Levels: Supports and Resistances
USDMXN currently trading at 16.7477 at the time of writing. Pair opened at 16.7419 and is trading with a change of 0.03% % .
| Overview | Overview.1 | |
|---|---|---|
| 0 | Today last price | 16.7477 |
| 1 | Today Daily Change | 0.0058 |
| 2 | Today Daily Change % | 0.03% |
| 3 | Today daily open | 16.7419 |
The pair remains strongly bearish on the daily time frame. It trades below the 20 SMA @ 16.9965, 50 SMA 16.9766, 100 SMA @ 17.3237 and 200 SMA @ 18.0877.
| Trends | Trends.1 | |
|---|---|---|
| 0 | Daily SMA20 | 16.9965 |
| 1 | Daily SMA50 | 16.9766 |
| 2 | Daily SMA100 | 17.3237 |
| 3 | Daily SMA200 | 18.0877 |
The previous day high was 16.8036 while the previous day low was 16.7269. The daily 38.2% Fib levels comes at 16.7562, expected to provide resistance. Similarly, the daily 61.8% fib level is at 16.7743, expected to provide resistance.
Note the levels of interest below:
- Pivot support is noted at 16.7114, 16.6808, 16.6347
- Pivot resistance is noted at 16.788, 16.8341, 16.8646
| Levels | Levels.1 |
|---|---|
| Previous Daily High | 16.8036 |
| Previous Daily Low | 16.7269 |
| Previous Weekly High | 17.0800 |
| Previous Weekly Low | 16.7366 |
| Previous Monthly High | 17.3957 |
| Previous Monthly Low | 16.6258 |
| Daily Fibonacci 38.2% | 16.7562 |
| Daily Fibonacci 61.8% | 16.7743 |
| Daily Pivot Point S1 | 16.7114 |
| Daily Pivot Point S2 | 16.6808 |
| Daily Pivot Point S3 | 16.6347 |
| Daily Pivot Point R1 | 16.7880 |
| Daily Pivot Point R2 | 16.8341 |
| Daily Pivot Point R3 | 16.8646 |
[/s2If]
Download Nehcap EAWe have two EAs that are operational on our LIVE accounts.
- EA-FIX: Check out the details here. Download EA-FIX . EA-FIX is a non-grid HFT scalper.
- EA-GROWTH: High quality low dd EA using trend grids. Download EA_GROWTHJoin Our Telegram Group


