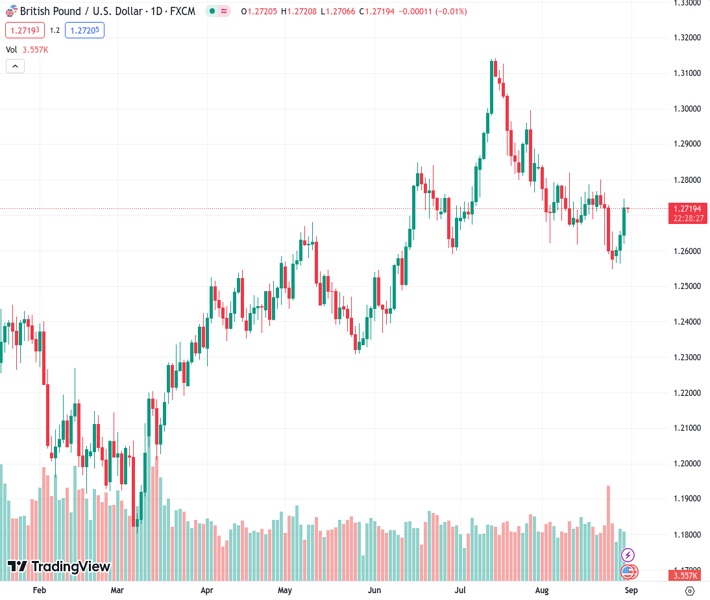
The GBPUSD currency pair, currently trading at 1.27193, is testing a descending resistance line that has been in place for a month. This move is occurring at the highest level of the week. According to the viewpoint of @nehcap, it is anticipated that the price will continue to rise.
…
This is a premium post.
[s2If !current_user_can(access_s2member_level4)]Please register for FREE REGISTER to read full post below containing analysis. In case of any error or you think you are not able to read the full post below, please email us at support#nehcap.com [lwa][/s2If] [s2If current_user_can(access_s2member_level1)]
- GBP/USD prods one-month-old descending resistance line at weekly top.
The pair currently trades last at 1.27193.
The previous day high was 1.2655 while the previous day low was 1.2563. The daily 38.2% Fib levels comes at 1.262, expected to provide support. Similarly, the daily 61.8% fib level is at 1.2598, expected to provide support.
GBP/USD buyers attack a downward-sloping resistance line from late July as they await the key US inflation gauge while pausing the three-day uptrend amid early Thursday morning in Asia. In doing so, the Cable pair seesaws around the 1.2720 level while defending the previous week’s rebound from a five-month-old horizontal support zone.
Not only a clear rebound from the key horizontal support but the impending bull cross on the MACD and the steady RSI (14) line also keep the GBP/USD buyers hopeful.
With this, the Pound Sterling is likely to cross the 1.2720 upside hurdle.
However, the 50-DMA level of 1.2780 acts as the last defense of the GBP/USD bears before giving control to the buyers.
Following that, a run-up towards the previous support line stretched from early March, close to 1.2930, and then to the 1.3000 psychological magnet can’t be ruled out.
On the flip side, the GBP/USD pair’s pullback may aim for the monthly horizontal area surrounding 1.2620–15 before revisiting the horizontal area comprising multiple levels marked since early April, close to 1.2545–30.
In a case where the Cable pair drops below 1.2530, it becomes vulnerable to decline toward May’s bottom of around 1.2310.
Trend: Further upside expected
Technical Levels: Supports and Resistances
GBPUSD currently trading at 1.2719 at the time of writing. Pair opened at 1.2644 and is trading with a change of 0.59% % .
| Overview | Overview.1 | |
|---|---|---|
| 0 | Today last price | 1.2719 |
| 1 | Today Daily Change | 0.0075 |
| 2 | Today Daily Change % | 0.59% |
| 3 | Today daily open | 1.2644 |
The pair is trading above its 20 Daily moving average @ 1.2702, below its 50 Daily moving average @ 1.2782 , above its 100 Daily moving average @ 1.2644 and above its 200 Daily moving average @ 1.2407
| Trends | Trends.1 | |
|---|---|---|
| 0 | Daily SMA20 | 1.2702 |
| 1 | Daily SMA50 | 1.2782 |
| 2 | Daily SMA100 | 1.2644 |
| 3 | Daily SMA200 | 1.2407 |
The previous day high was 1.2655 while the previous day low was 1.2563. The daily 38.2% Fib levels comes at 1.262, expected to provide support. Similarly, the daily 61.8% fib level is at 1.2598, expected to provide support.
Note the levels of interest below:
- Pivot support is noted at 1.2586, 1.2528, 1.2494
- Pivot resistance is noted at 1.2678, 1.2713, 1.277
| Levels | Levels.1 |
|---|---|
| Previous Daily High | 1.2655 |
| Previous Daily Low | 1.2563 |
| Previous Weekly High | 1.2800 |
| Previous Weekly Low | 1.2548 |
| Previous Monthly High | 1.3142 |
| Previous Monthly Low | 1.2659 |
| Daily Fibonacci 38.2% | 1.2620 |
| Daily Fibonacci 61.8% | 1.2598 |
| Daily Pivot Point S1 | 1.2586 |
| Daily Pivot Point S2 | 1.2528 |
| Daily Pivot Point S3 | 1.2494 |
| Daily Pivot Point R1 | 1.2678 |
| Daily Pivot Point R2 | 1.2713 |
| Daily Pivot Point R3 | 1.2770 |
[/s2If]
Download Nehcap EAWe have two EAs that are operational on our LIVE accounts.
- EA-FIX: Check out the details here. Download EA-FIX . EA-FIX is a non-grid HFT scalper.
- EA-GROWTH: High quality low dd EA using trend grids. Download EA_GROWTHJoin Our Telegram Group
")


