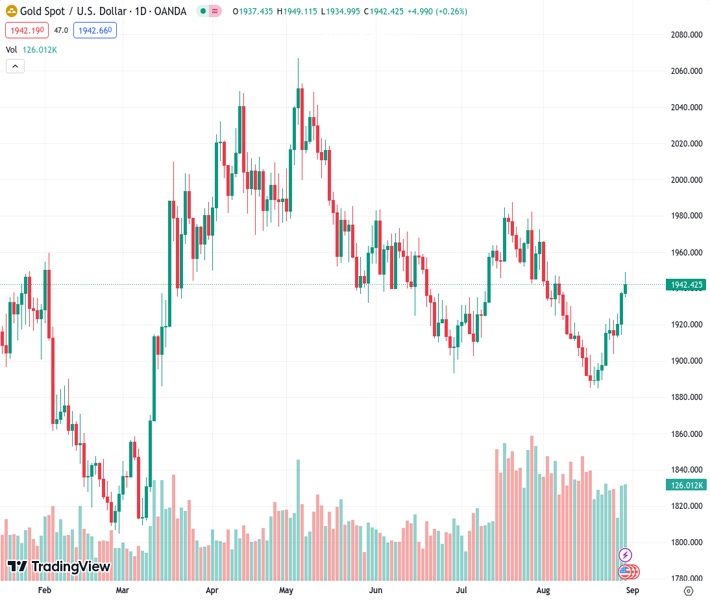
The XAUUSD pair, currently at 1,942.54, has achieved three consecutive days of gains and is trading close to the $1,940 level, with approximately 0.30% increase in daily value.
…
This is a premium post.
[s2If !current_user_can(access_s2member_level4)]Please register for FREE REGISTER to read full post below containing analysis. In case of any error or you think you are not able to read the full post below, please email us at support#nehcap.com [lwa][/s2If] [s2If current_user_can(access_s2member_level1)]
- XAU/USD tallies a three-day winning streak, trading near the $1,940 area, with around 0.30% of daily gains.
The pair currently trades last at 1942.54.
The previous day high was 1938.21 while the previous day low was 1914.49. The daily 38.2% Fib levels comes at 1929.15, expected to provide support. Similarly, the daily 61.8% fib level is at 1923.55, expected to provide support.
On Wednesday, the XAU/USD continued gaining traction for a third consecutive day, trading around the $1,940 zone, showing nearly 1.50% gains in the bullish streak. The pessimistic labour market data for the US caused the Greenback to trade weak against most of its rivals in Wednesday’s session on the back of decreasing US Treasury bond yields, which allowed the yellow metal to find demand.
While market participants continued to digest soft July JOLTS Job Openings from Tuesday, the US reported weaker labour market figures on Wednesday as ADP Employment Change increased by 177,000 employed people in the US, lower than the expected 195,000 and the previous 371,000.
It’s worth mentioning that Jerome Powell highlighted at last week’s Jackson Hole Symposium that the restrictive monetary policy will be maintained until the data shows a cooling trend and weak economic figures from the US opened the downside of the Treasury yields, which weighs on the Greenback. That said, the US bond for 2, 5 and 10-year yields decreased to 4.88%, 4.26% and 4.11%, respectively, with around 0.40% daily losses. As the Treasury bond yields are often seen as the opportunity cost of holding gold, their decrease explains the XAU/USD advance.
As for now, the CME FedWatch Tool suggests that investors are betting on higher odds that the Federal Reserve (Fed) won’t hike in the September 20 meeting, while the odds of a hike in November slightly decreased to 40%. In addition, swaps markets are now discounting sooner rate cuts in June 2024, which also applies downside pressure to the US bond yields. However, these bets may change after Friday’s release of the Nonfarm Payrolls from August.
According to the daily chart, the XAU/USD outlook is bullish for the short term as the Relative Strength Index (RSI) shows a pronounced slope pointing north in the positive territory. In addition, the Moving Average Convergence Divergence (MACD) histogram lays out rising green bars, indicating that bulls are gaining ground. On the bigger picture, the pair trades above the 20-day and 200-day Simple Moving Averages (SMAs), suggesting that the bulls recovered significant ground in the short term. Traders should see a potential bullish cross between the mentioned averages, which could further boost the buying momentum.
Resistance levels:$1,950, $1,955 (100-day SMA), $1,970.
Support levels: $1, 940, $1,930, $1,915.
Technical Levels: Supports and Resistances
XAUUSD currently trading at 1942.42 at the time of writing. Pair opened at 1937.56 and is trading with a change of 0.25 % .
| Overview | Overview.1 | |
|---|---|---|
| 0 | Today last price | 1942.42 |
| 1 | Today Daily Change | 4.86 |
| 2 | Today Daily Change % | 0.25 |
| 3 | Today daily open | 1937.56 |
The pair is trading above its 20 Daily moving average @ 1914.57, above its 50 Daily moving average @ 1930.17 , below its 100 Daily moving average @ 1956.66 and above its 200 Daily moving average @ 1912.0
| Trends | Trends.1 | |
|---|---|---|
| 0 | Daily SMA20 | 1914.57 |
| 1 | Daily SMA50 | 1930.17 |
| 2 | Daily SMA100 | 1956.66 |
| 3 | Daily SMA200 | 1912.00 |
The previous day high was 1938.21 while the previous day low was 1914.49. The daily 38.2% Fib levels comes at 1929.15, expected to provide support. Similarly, the daily 61.8% fib level is at 1923.55, expected to provide support.
Note the levels of interest below:
- Pivot support is noted at 1921.96, 1906.37, 1898.24
- Pivot resistance is noted at 1945.68, 1953.81, 1969.4
| Levels | Levels.1 |
|---|---|
| Previous Daily High | 1938.21 |
| Previous Daily Low | 1914.49 |
| Previous Weekly High | 1923.43 |
| Previous Weekly Low | 1884.85 |
| Previous Monthly High | 1987.54 |
| Previous Monthly Low | 1902.77 |
| Daily Fibonacci 38.2% | 1929.15 |
| Daily Fibonacci 61.8% | 1923.55 |
| Daily Pivot Point S1 | 1921.96 |
| Daily Pivot Point S2 | 1906.37 |
| Daily Pivot Point S3 | 1898.24 |
| Daily Pivot Point R1 | 1945.68 |
| Daily Pivot Point R2 | 1953.81 |
| Daily Pivot Point R3 | 1969.40 |
[/s2If]
Download Nehcap EAWe have two EAs that are operational on our LIVE accounts.
- EA-FIX: Check out the details here. Download EA-FIX . EA-FIX is a non-grid HFT scalper.
- EA-GROWTH: High quality low dd EA using trend grids. Download EA_GROWTHJoin Our Telegram Group
")


