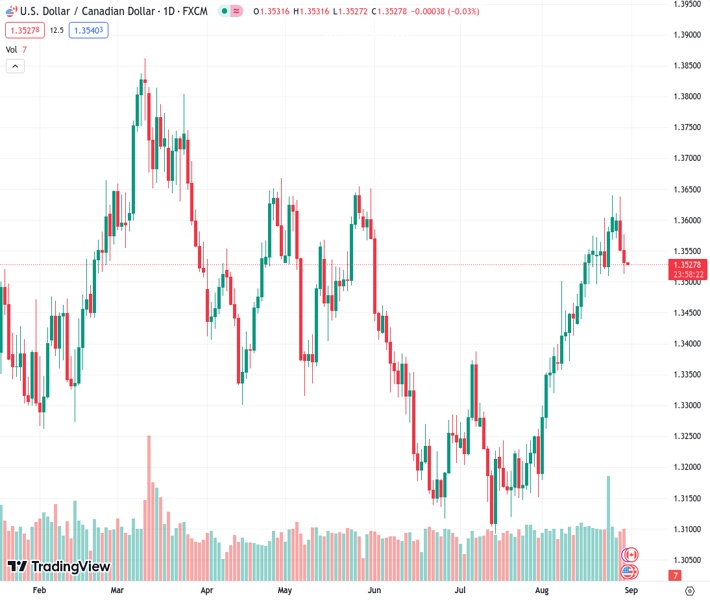
The exchange rate for the US dollar against the Canadian dollar, which was initially at 1.35320, dropped to 1.3530, resulting in continued losses for the second consecutive day.
…
This is a premium post.
[s2If !current_user_can(access_s2member_level4)]Please register for FREE REGISTER to read full post below containing analysis. In case of any error or you think you are not able to read the full post below, please email us at support#nehcap.com [lwa][/s2If] [s2If current_user_can(access_s2member_level1)]
- USD/CAD fell to 1.3530, tallying losses for the second day.
The pair currently trades last at 1.35320.
The previous day high was 1.3637 while the previous day low was 1.355. The daily 38.2% Fib levels comes at 1.3583, expected to provide resistance. Similarly, the daily 61.8% fib level is at 1.3604, expected to provide resistance.
In the middle of the week, the USD was one of the worst performers in the FX markets, driven by soft ADP Employment figures and downward revisions of the Gross Domestic Product (GDP) annualised rate. On the CAD’s side, no relevant data was released as investors’ eyes are on Friday’s Q2 GDP figures revisions from Canada.
The GDP annualised growth rates figures from the United States was revised lower to 2.1%, while the ADP Employment Change figures missed the consensus in August. They showed that the US economy added 177,000 figures, lower than the 195,000 expected and the previous 371,000. The cooling economy evidence remained investors that Jerome Powell stated last Friday that the Federal Reserve (Fed) would maintain its policy at restrictive levels if the economy didn’t cool down.
According to the CME FedWatch tool, markets are now pricing in that the Federal Reserve will cut rates in June 2024 sooner than the previous expectations, while the odds of a hike in November remain near 40%. For the rest of the week, investors will eye Personal Consumption Expenditures (PCE) figures from July on Thursday and Friday’s Nonfarm Payrolls from August.
The daily chart analysis indicates a neutral to a bearish outlook for USD/CAD, as the bears show signs of taking control but still face challenges ahead. The Relative Strength Index (RSI) points downwards in the bullish territory, suggesting a possible trend reversal, while the Moving Average Convergence (MACD) shows weaker green bars. However, the pair is above the 20,100,200-day Simple Moving Average (SMA), pointing towards the prevailing strength of the bulls in the larger context.
Support levels: 1.3495 (20-day SMA), 1.3460 (200-day SMA), 1.3450.
Resistance levels: 1.3575, 1.3590, 1.3600.
Technical Levels: Supports and Resistances
USDCAD currently trading at 1.3532 at the time of writing. Pair opened at 1.3552 and is trading with a change of -0.15 % .
| Overview | Overview.1 | |
|---|---|---|
| 0 | Today last price | 1.3532 |
| 1 | Today Daily Change | -0.0020 |
| 2 | Today Daily Change % | -0.1500 |
| 3 | Today daily open | 1.3552 |
The pair remains strongly bullish on the daily timeframe. It trades above its 20 SMA @ 1.3486, 50 SMA 1.3323, 100 SMA @ 1.3391 and 200 SMA @ 1.3461.
| Trends | Trends.1 | |
|---|---|---|
| 0 | Daily SMA20 | 1.3486 |
| 1 | Daily SMA50 | 1.3323 |
| 2 | Daily SMA100 | 1.3391 |
| 3 | Daily SMA200 | 1.3461 |
The previous day high was 1.3637 while the previous day low was 1.355. The daily 38.2% Fib levels comes at 1.3583, expected to provide resistance. Similarly, the daily 61.8% fib level is at 1.3604, expected to provide resistance.
Note the levels of interest below:
- Pivot support is noted at 1.3522, 1.3493, 1.3435
- Pivot resistance is noted at 1.361, 1.3667, 1.3697
| Levels | Levels.1 |
|---|---|
| Previous Daily High | 1.3637 |
| Previous Daily Low | 1.3550 |
| Previous Weekly High | 1.3640 |
| Previous Weekly Low | 1.3496 |
| Previous Monthly High | 1.3387 |
| Previous Monthly Low | 1.3093 |
| Daily Fibonacci 38.2% | 1.3583 |
| Daily Fibonacci 61.8% | 1.3604 |
| Daily Pivot Point S1 | 1.3522 |
| Daily Pivot Point S2 | 1.3493 |
| Daily Pivot Point S3 | 1.3435 |
| Daily Pivot Point R1 | 1.3610 |
| Daily Pivot Point R2 | 1.3667 |
| Daily Pivot Point R3 | 1.3697 |
[/s2If]
Download Nehcap EAWe have two EAs that are operational on our LIVE accounts.
- EA-FIX: Check out the details here. Download EA-FIX . EA-FIX is a non-grid HFT scalper.
- EA-GROWTH: High quality low dd EA using trend grids. Download EA_GROWTHJoin Our Telegram Group
")


