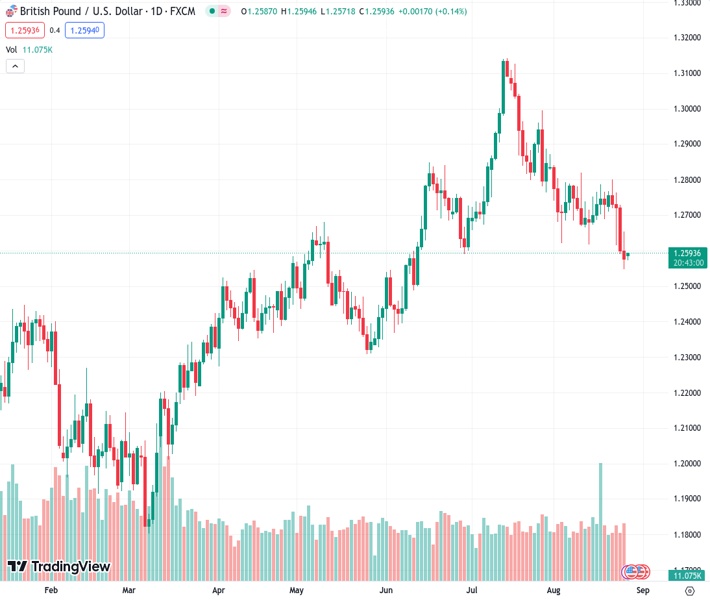
The GBPUSD pair is staying inactive at its lowest point in 13 weeks, with the expectation of more downward movement according to @nehcap.
…
This is a premium post.
[s2If !current_user_can(access_s2member_level4)]Please register for FREE REGISTER to read full post below containing analysis. In case of any error or you think you are not able to read the full post below, please email us at support#nehcap.com [lwa][/s2If] [s2If current_user_can(access_s2member_level1)]
- GBP/USD remains sidelined at the lowest level in 13 weeks.
The pair currently trades last at 1.25931.
The previous day high was 1.2655 while the previous day low was 1.2548. The daily 38.2% Fib levels comes at 1.2589, expected to provide support. Similarly, the daily 61.8% fib level is at 1.2614, expected to provide resistance.
GBP/USD picks up bids to print mild gains at the lowest levels since early June, up 0.10% intraday near 1.2585 amid the initial hours of Monday’s Asian session. In doing so, the Cable pair consolidated the biggest weekly loss since mid-July amid holidays in the UK, as well as backed by the hawkish comments from a Bank of England (BoE) official.
That said, BoE Deputy Governor Ben Broadbent appeared hawkish while speaking at the annual Jackson Hole Symposium on Saturday per Reuters. The policymaker, however, couldn’t ignore economic pessimism for the UK.
Also read: BoE’s Broadbent cites knock-on effects of the surge in prices to signal higher rates “for some time yet”
Technically, a sustained downside break of an ascending trend line from early November 2022 and the 100-DMA, respectively near 1.2725 and 1.2645, keeps the Pound Sterling sellers hopeful, especially amid the bearish MACD signals.
Even if the quote rises past 1.2725, the tops marked in June around 1.2850 will challenge the GBP/USD buyers before giving them control.
On the contrary, the early June swing low of around 1.2545 may check the Cable pair sellers ahead of directing them to a horizontal support zone comprising tops marked during the December 2022 and January 2023, close to 1.2450-45.
Following that, the 200-DMA support of around the 1.2400 threshold will act as the final defense of the GBP/USD buyers.
Trend: Further downside expected
Technical Levels: Supports and Resistances
GBPUSD currently trading at 1.2584 at the time of writing. Pair opened at 1.258 and is trading with a change of 0.03% % .
| Overview | Overview.1 | |
|---|---|---|
| 0 | Today last price | 1.2584 |
| 1 | Today Daily Change | 0.0004 |
| 2 | Today Daily Change % | 0.03% |
| 3 | Today daily open | 1.258 |
The pair is trading below its 20 Daily moving average @ 1.272, below its 50 Daily moving average @ 1.2788 , below its 100 Daily moving average @ 1.264 and above its 200 Daily moving average @ 1.24
| Trends | Trends.1 | |
|---|---|---|
| 0 | Daily SMA20 | 1.2720 |
| 1 | Daily SMA50 | 1.2788 |
| 2 | Daily SMA100 | 1.2640 |
| 3 | Daily SMA200 | 1.2400 |
The previous day high was 1.2655 while the previous day low was 1.2548. The daily 38.2% Fib levels comes at 1.2589, expected to provide support. Similarly, the daily 61.8% fib level is at 1.2614, expected to provide resistance.
Note the levels of interest below:
- Pivot support is noted at 1.2534, 1.2488, 1.2427
- Pivot resistance is noted at 1.2641, 1.2701, 1.2747
| Levels | Levels.1 |
|---|---|
| Previous Daily High | 1.2655 |
| Previous Daily Low | 1.2548 |
| Previous Weekly High | 1.2800 |
| Previous Weekly Low | 1.2548 |
| Previous Monthly High | 1.3142 |
| Previous Monthly Low | 1.2659 |
| Daily Fibonacci 38.2% | 1.2589 |
| Daily Fibonacci 61.8% | 1.2614 |
| Daily Pivot Point S1 | 1.2534 |
| Daily Pivot Point S2 | 1.2488 |
| Daily Pivot Point S3 | 1.2427 |
| Daily Pivot Point R1 | 1.2641 |
| Daily Pivot Point R2 | 1.2701 |
| Daily Pivot Point R3 | 1.2747 |
[/s2If]
Download Nehcap EAWe have two EAs that are operational on our LIVE accounts.
- EA-FIX: Check out the details here. Download EA-FIX . EA-FIX is a non-grid HFT scalper.
- EA-GROWTH: High quality low dd EA using trend grids. Download EA_GROWTHJoin Our Telegram Group
")


