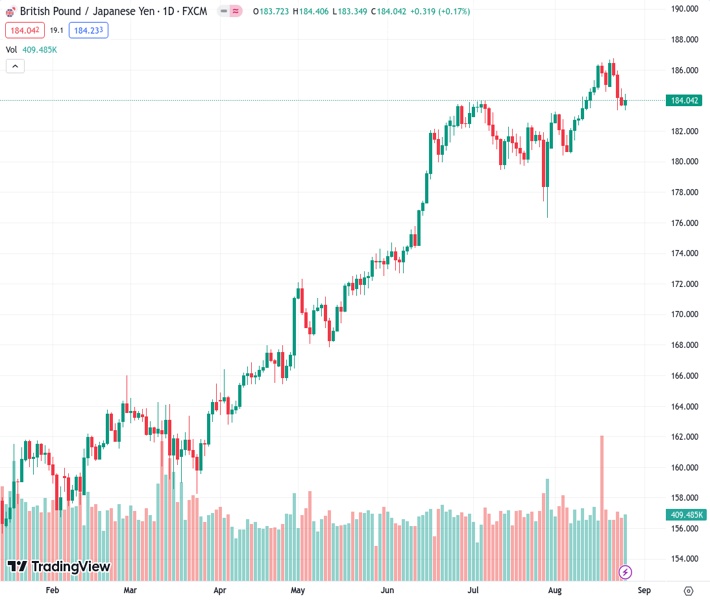
The GBPJPY pair increased close to 184.15 from 184.136, but there is a possibility of a future decline as the bullish momentum weakens.
…
This is a premium post.
[s2If !current_user_can(access_s2member_level4)]Please register for FREE REGISTER to read full post below containing analysis. In case of any error or you think you are not able to read the full post below, please email us at support#nehcap.com [lwa][/s2If] [s2If current_user_can(access_s2member_level1)]
- GBP/JPY rose near 184.15, but further downside may be on the horizon as bullish momentum wanes.
The pair currently trades last at 184.136.
The previous day high was 184.78 while the previous day low was 183.6. The daily 38.2% Fib levels comes at 184.05, expected to provide support. Similarly, the daily 61.8% fib level is at 184.33, expected to provide resistance.
At the end of the week, the GBP/JPY slightly advanced, tallying a 0.50% weekly loss. Inflation figures from July from Japan weakened the Yen while the GBP trades relatively soft against its rivals. There won’t be any highlights for the rest of the session, and the focus is on Ueda’s and BoE’s official speeches on Saturday.
On the Japanese front, August’s Tokyo Consumer Price Index (CPI) came in soft and decelerated to 2.9% YoY vs. the 3% expected and the previous 3.2%. The Core CPI remained steady at 4%, while the measure excluding Fresh Foods failed to meet expectations and fell to 2.8% YoY, lower than the 2.9% expected. The low inflation readings exacerbated the dovish bets on the Bank of Japan (CPI), contributing to the JPY being one of the worst performers during the session amongst the major currencies. Focus now shifts to Governor Ueda’s speech on Saturday.
On the other hand, the Pound continues to trade weak against its rivals following the poor results of the S&P Global PMIs from August. The economy showed signs of weakness and flashed alarms amongst the investors concerning the British economy’s health. Last week, the UK reported strong wages and inflation data, which doesn’t align with an economy sliding into a recession, just as the Bank of England (BoE) stated in its last statement.
Looking forward, markets continue to bet on the BoE lifting rates between 5.75%-6% in this cycle, including 25 basis points hikes in September, November and February 2024.
The technical analysis of the daily chart points to a neutral to a bearish outlook for GBP/JPY, indicating a decline in bullish strength. The Relative Strength Index (RSI) points north above its middle point, while the Moving Average Convergence (MACD) displays stagnant red bars. On the other hand, the pair is above the 20,100,200-day SMAs, indicating that the bulls are in command of the broader picture.
Support levels: 183.20 (20-day SMA), 182.00, 181.00
Resistance levels: 184.00, 185.00, 186.00.
Technical Levels: Supports and Resistances
GBPJPY currently trading at 184.23 at the time of writing. Pair opened at 183.74 and is trading with a change of 0.27 % .
| Overview | Overview.1 | |
|---|---|---|
| 0 | Today last price | 184.23 |
| 1 | Today Daily Change | 0.49 |
| 2 | Today Daily Change % | 0.27 |
| 3 | Today daily open | 183.74 |
The pair remains strongly bullish on the daily timeframe. It trades above its 20 SMA @ 183.69, 50 SMA 182.62, 100 SMA @ 176.64 and 200 SMA @ 169.47.
| Trends | Trends.1 | |
|---|---|---|
| 0 | Daily SMA20 | 183.69 |
| 1 | Daily SMA50 | 182.62 |
| 2 | Daily SMA100 | 176.64 |
| 3 | Daily SMA200 | 169.47 |
The previous day high was 184.78 while the previous day low was 183.6. The daily 38.2% Fib levels comes at 184.05, expected to provide support. Similarly, the daily 61.8% fib level is at 184.33, expected to provide resistance.
Note the levels of interest below:
- Pivot support is noted at 183.3, 182.87, 182.13
- Pivot resistance is noted at 184.47, 185.21, 185.64
| Levels | Levels.1 |
|---|---|
| Previous Daily High | 184.78 |
| Previous Daily Low | 183.60 |
| Previous Weekly High | 186.47 |
| Previous Weekly Low | 183.46 |
| Previous Monthly High | 184.02 |
| Previous Monthly Low | 176.32 |
| Daily Fibonacci 38.2% | 184.05 |
| Daily Fibonacci 61.8% | 184.33 |
| Daily Pivot Point S1 | 183.30 |
| Daily Pivot Point S2 | 182.87 |
| Daily Pivot Point S3 | 182.13 |
| Daily Pivot Point R1 | 184.47 |
| Daily Pivot Point R2 | 185.21 |
| Daily Pivot Point R3 | 185.64 |
[/s2If]
Download Nehcap EAWe have two EAs that are operational on our LIVE accounts.
- EA-FIX: Check out the details here. Download EA-FIX . EA-FIX is a non-grid HFT scalper.
- EA-GROWTH: High quality low dd EA using trend grids. Download EA_GROWTHJoin Our Telegram Group
")


