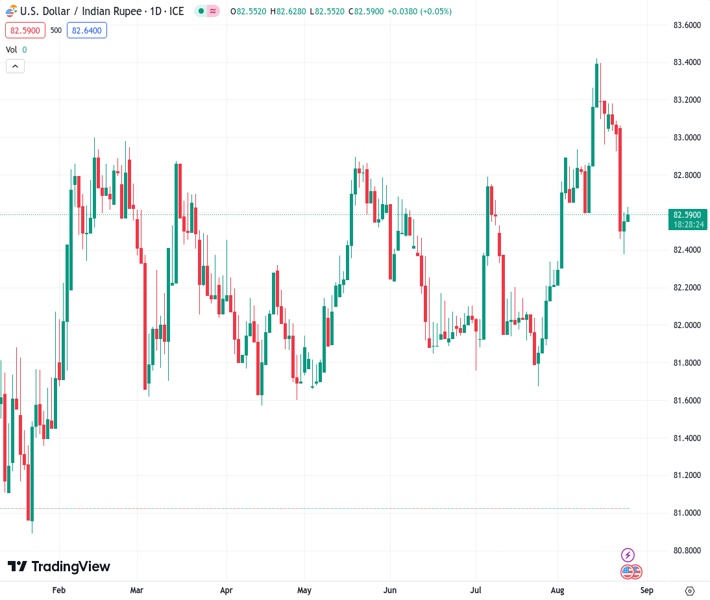
The USDINR is experiencing an increase in value at 82.5690, attributed to the optimistic sentiment surrounding the US Dollar.
…
This is a premium post.
[s2If !current_user_can(access_s2member_level4)]Please register for FREE REGISTER to read full post below containing analysis. In case of any error or you think you are not able to read the full post below, please email us at support#nehcap.com [lwa][/s2If] [s2If current_user_can(access_s2member_level1)]
- USD/INR trades higher due to the positive tone around the US Dollar (USD).
The pair currently trades last at 82.5690.
The previous day high was 82.8 while the previous day low was 82.3485. The daily 38.2% Fib levels comes at 82.6275, expected to provide resistance. Similarly, the daily 61.8% fib level is at 82.521, expected to provide support.
USD/INR trades sideways around 82.50 psychological level at the time of writing during the Asian session on Friday, recovering recent losses. The pair is cheering up the positive sentiment around the US Dollar (USD) due to the upbeat US employment data released on Thursday.
The 23.6% Finonacci retracement at 82.62 acts as immediate resistance, followed by the 38.2% Finonacci retracement at 82.79. A break above the latter could support the USD/INR pair to explore the nine-day Exponential Moving Average (EMA) at 82.84.
On the downside, the pair could meet support around the weekly low at 82.37 level, followed by the 82.00 psychological level.
The 14-day Relative Strength Index (RSI) remains below 50, which suggests a bearish bias of the USD/JPY traders. The Moving Average Convergence Divergence (MACD) line stays above the centerline but lies below the signal line, which suggests that recent momentum is weaker.
Technical Levels: Supports and Resistances
USDINR currently trading at 82.5886 at the time of writing. Pair opened at 82.5816 and is trading with a change of 0.01 % .
| Overview | Overview.1 | |
|---|---|---|
| 0 | Today last price | 82.5886 |
| 1 | Today Daily Change | 0.0070 |
| 2 | Today Daily Change % | 0.0100 |
| 3 | Today daily open | 82.5816 |
The pair is trading below its 20 Daily moving average @ 82.8556, above its 50 Daily moving average @ 82.4123 , above its 100 Daily moving average @ 82.3084 and above its 200 Daily moving average @ 82.257
| Trends | Trends.1 | |
|---|---|---|
| 0 | Daily SMA20 | 82.8556 |
| 1 | Daily SMA50 | 82.4123 |
| 2 | Daily SMA100 | 82.3084 |
| 3 | Daily SMA200 | 82.2570 |
The previous day high was 82.8 while the previous day low was 82.3485. The daily 38.2% Fib levels comes at 82.6275, expected to provide resistance. Similarly, the daily 61.8% fib level is at 82.521, expected to provide support.
Note the levels of interest below:
- Pivot support is noted at 82.3534, 82.1252, 81.9019
- Pivot resistance is noted at 82.8049, 83.0282, 83.2564
| Levels | Levels.1 |
|---|---|
| Previous Daily High | 82.8000 |
| Previous Daily Low | 82.3485 |
| Previous Weekly High | 83.5505 |
| Previous Weekly Low | 82.8946 |
| Previous Monthly High | 82.8334 |
| Previous Monthly Low | 81.6588 |
| Daily Fibonacci 38.2% | 82.6275 |
| Daily Fibonacci 61.8% | 82.5210 |
| Daily Pivot Point S1 | 82.3534 |
| Daily Pivot Point S2 | 82.1252 |
| Daily Pivot Point S3 | 81.9019 |
| Daily Pivot Point R1 | 82.8049 |
| Daily Pivot Point R2 | 83.0282 |
| Daily Pivot Point R3 | 83.2564 |
[/s2If]
Download Nehcap EAWe have two EAs that are operational on our LIVE accounts.
- EA-FIX: Check out the details here. Download EA-FIX . EA-FIX is a non-grid HFT scalper.
- EA-GROWTH: High quality low dd EA using trend grids. Download EA_GROWTHJoin Our Telegram Group
")


