The US dollar to Mexican peso exchange rate is currently at 16.7685, experiencing a decrease of 0.12%. Traders are eagerly anticipating a speech from Fed Chair Powell, while also considering the conflicting economic data from the US.
…
This is a premium post.
[s2If !current_user_can(access_s2member_level4)]Please register for FREE REGISTER to read full post below containing analysis. In case of any error or you think you are not able to read the full post below, please email us at support#nehcap.com [lwa][/s2If] [s2If current_user_can(access_s2member_level1)]
- USD/MXN down 0.12%, trading at 16.7685, as traders await Fed Chair Powell’s speech amid mixed US economic data.
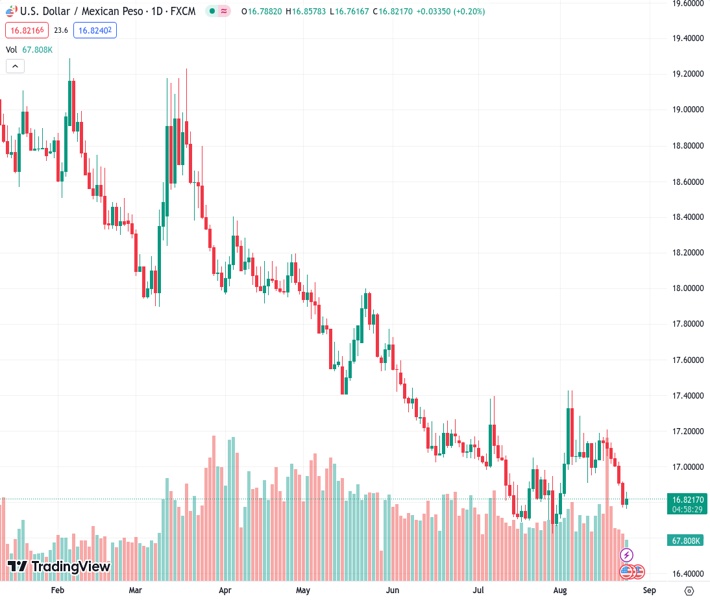
The pair currently trades last at 16.8221.
The previous day high was 16.9235 while the previous day low was 16.781. The daily 38.2% Fib levels comes at 16.8354, expected to provide resistance. Similarly, the daily 61.8% fib level is at 16.869, expected to provide resistance.
USD/MXN trims some of its earlier losses as a Federal Reserve official rocks the boat. At the same time, mixed economic data from the United States (US) leaves traders focused on the Fed’s Chair Powell speech on Friday. The USD/MXN is trading at 16.7685, down 0.12%.
Philadelphia Fed President Patrick Harker began the Fed parade ahead of the weekend. Harker said the Fed must keep its restrictive stance and added the Fed has probably done enough but must hold rates at the current level. He noted that inflation must fall to pave the way for rate cuts while acknowledging an eventual economic slowdown.
Earlier, US Durable Good Orders plunged -5.2, exceeding estimates of -4, weighed by falling Boeing orders. Excluding Transports, orders were steady at 0.5%, as in June, above 0.1% MoM forecasts by analysts. At the same time, the US Department of Labor revealed the labor market remains tight, as shown by unemployment claims for the week ending August 19, which rose by 230K, below estimates of 240K and 9K below the previous week.
The US Dollar Index (DXY), a gauge of the buck’s value against a basket of currencies, advances 0.44%, up at 103.818, underpinned by US Treasury bond yields climbing on Fed’s Harker words.
Across the border, inflation for the first half of August was above estimates monthly, at 0.32% vs. 0.28% foreseen, while annually based, edged to 4.67%, aligned with the consensus. Core inflation edged a tick lower after the Bank of Mexico (Banxico) increased rates toward 11.25%.
Recently, Banxico revealed its latest meeting minutes, which showed that inflation remains high, mentioned by all the members, while emphasizing the need to keep rates at their current level for an extended period. They said that services CPI begins to show a clear turn to the downside.
Given the backdrop, all eyes would turn to Fed Chair Powell’s speech at Jackson Hole. Hence, further USD/MXN downside is expected, as Banxico’s minutes show that its members remain focused on tackling inflation and have not given any dovish signal.
The pair remains in a downtrend after standing above the 17.0000 figure, with the USD/MXN set to retest the year-to-date (YTD( low of 16.6238. As of writing, the USD/MXN is testing a previous resistance trendline, turned support, stalling the downtrend. A break below the YTD low would expose the 16.5000 mark, followed by the October 2015 low of 16.3267.
Technical Levels: Supports and Resistances
USDMXN currently trading at 16.808 at the time of writing. Pair opened at 16.7917 and is trading with a change of 0.1 % .
| Overview | Overview.1 | |
|---|---|---|
| 0 | Today last price | 16.8080 |
| 1 | Today Daily Change | 0.0163 |
| 2 | Today Daily Change % | 0.1000 |
| 3 | Today daily open | 16.7917 |
The pair remains strongly bearish on the daily time frame. It trades below the 20 SMA @ 17.0111, 50 SMA 17.0105, 100 SMA @ 17.3926 and 200 SMA @ 18.154.
| Trends | Trends.1 | |
|---|---|---|
| 0 | Daily SMA20 | 17.0111 |
| 1 | Daily SMA50 | 17.0105 |
| 2 | Daily SMA100 | 17.3926 |
| 3 | Daily SMA200 | 18.1540 |
The previous day high was 16.9235 while the previous day low was 16.781. The daily 38.2% Fib levels comes at 16.8354, expected to provide resistance. Similarly, the daily 61.8% fib level is at 16.869, expected to provide resistance.
Note the levels of interest below:
- Pivot support is noted at 16.7406, 16.6895, 16.5981
- Pivot resistance is noted at 16.8831, 16.9746, 17.0256
| Levels | Levels.1 |
|---|---|
| Previous Daily High | 16.9235 |
| Previous Daily Low | 16.7810 |
| Previous Weekly High | 17.2094 |
| Previous Weekly Low | 16.9663 |
| Previous Monthly High | 17.3957 |
| Previous Monthly Low | 16.6258 |
| Daily Fibonacci 38.2% | 16.8354 |
| Daily Fibonacci 61.8% | 16.8690 |
| Daily Pivot Point S1 | 16.7406 |
| Daily Pivot Point S2 | 16.6895 |
| Daily Pivot Point S3 | 16.5981 |
| Daily Pivot Point R1 | 16.8831 |
| Daily Pivot Point R2 | 16.9746 |
| Daily Pivot Point R3 | 17.0256 |
[/s2If]
Download Nehcap EAWe have two EAs that are operational on our LIVE accounts.
- EA-FIX: Check out the details here. Download EA-FIX . EA-FIX is a non-grid HFT scalper.
- EA-GROWTH: High quality low dd EA using trend grids. Download EA_GROWTHJoin Our Telegram Group
")


