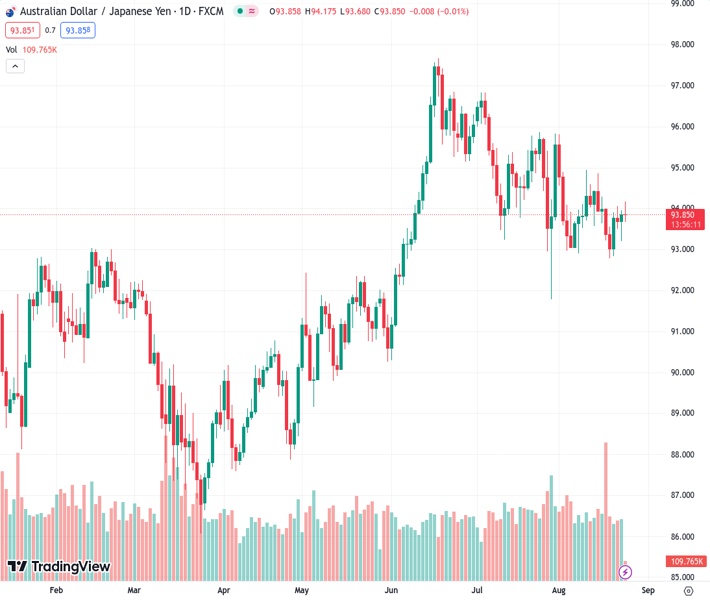
Since the middle of June, the AUDJPY currency pair has been trading in a downward trend channel at a price level of 93.8460.
…
This is a premium post.
[s2If !current_user_can(access_s2member_level4)]Please register for FREE REGISTER to read full post below containing analysis. In case of any error or you think you are not able to read the full post below, please email us at support#nehcap.com [lwa][/s2If] [s2If current_user_can(access_s2member_level1)]
- AUD/JPY trades within a descending trend channel from the middle of June.
The pair currently trades last at 93.8460.
The previous day high was 93.96 while the previous day low was 93.23. The daily 38.2% Fib levels comes at 93.68, expected to provide support. Similarly, the daily 61.8% fib level is at 93.51, expected to provide support.
The AUD/JPY cross loses momentum near 94.00 heading into the early European trading hours on Thursday. The cautious mood in the market and the downbeat Australian S&P Global PMI data weigh on the Aussie and act as a headwind for the cross.
The Australian S&P Global Composite PMI fell to 47.1 on Wednesday, from 48.2 in July. In the meantime, the Manufacturing PMI decreased to 49.4 from the 49.6 anticipated and previous, and the Service PMI decreased to 46.7 from 47.9 expected and in the previous month. Apart from the data, the divergence of monetary policy between the Bank of Japan (BoJ) and the Reserve Bank of Australia (RBA) might cap the downside in AUD/JPY as the Japanese central bank keeps ultra-easy monetary policy while allowing long-term rates to move more flexibly.
According to the four-hour chart, AUD/JPY trades within a descending trend channel since the middle of June. That said, the path of least resistance for the AUD/JPY is to the upside as the cross just holds above the 50- and 100-hour Exponential Moving Averages (EMAs).
The first resistance level for AUD/JPY emerges at 94.40, representing the upper boundary of a descending trend channel. The additional upside filter to watch is 94.90 (high of August 15). Any meaningful follow-through buying above the latter will see a rally to 95.40 (high of July 14) and finally at 95.85 (high of July 31).
On the flip side, the cross will meet the initial support level at 93.70, highlighting a confluence of the 50-hour EMA and a low of August 16. The next downside stop appears at 93.50 (low of August 22), followed by a psychological figure at 93.00. A break below the latter will see a drop to 92.60 (the midline of the descending trend channel) en route to 91.80 (the high of May 8) and finally at 91.35 (the lower limit of the descending trend channel).
It’s worth noting that the Relative Strength Index (RSI) holds bullish territory above 50, supporting the buyers for now.
Technical Levels: Supports and Resistances
AUDJPY currently trading at 93.92 at the time of writing. Pair opened at 93.88 and is trading with a change of 0.04 % .
| Overview | Overview.1 | |
|---|---|---|
| 0 | Today last price | 93.92 |
| 1 | Today Daily Change | 0.04 |
| 2 | Today Daily Change % | 0.04 |
| 3 | Today daily open | 93.88 |
The pair is trading above its 20 Daily moving average @ 93.91, below its 50 Daily moving average @ 94.93 , above its 100 Daily moving average @ 92.95 and above its 200 Daily moving average @ 91.9
| Trends | Trends.1 | |
|---|---|---|
| 0 | Daily SMA20 | 93.91 |
| 1 | Daily SMA50 | 94.93 |
| 2 | Daily SMA100 | 92.95 |
| 3 | Daily SMA200 | 91.90 |
The previous day high was 93.96 while the previous day low was 93.23. The daily 38.2% Fib levels comes at 93.68, expected to provide support. Similarly, the daily 61.8% fib level is at 93.51, expected to provide support.
Note the levels of interest below:
- Pivot support is noted at 93.42, 92.96, 92.68
- Pivot resistance is noted at 94.15, 94.42, 94.88
| Levels | Levels.1 |
|---|---|
| Previous Daily High | 93.96 |
| Previous Daily Low | 93.23 |
| Previous Weekly High | 94.87 |
| Previous Weekly Low | 92.79 |
| Previous Monthly High | 96.84 |
| Previous Monthly Low | 91.79 |
| Daily Fibonacci 38.2% | 93.68 |
| Daily Fibonacci 61.8% | 93.51 |
| Daily Pivot Point S1 | 93.42 |
| Daily Pivot Point S2 | 92.96 |
| Daily Pivot Point S3 | 92.68 |
| Daily Pivot Point R1 | 94.15 |
| Daily Pivot Point R2 | 94.42 |
| Daily Pivot Point R3 | 94.88 |
[/s2If]
Download Nehcap EAWe have two EAs that are operational on our LIVE accounts.
- EA-FIX: Check out the details here. Download EA-FIX . EA-FIX is a non-grid HFT scalper.
- EA-GROWTH: High quality low dd EA using trend grids. Download EA_GROWTHJoin Our Telegram Group
")


