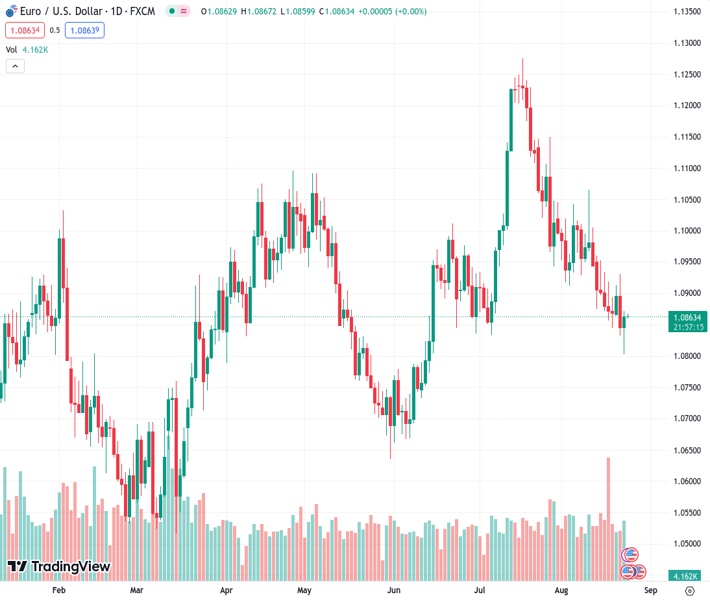
The currency pair EURUSD, currently at 1.08646, is fluctuating within a narrow range following a significant recovery from a low point over multiple days.
…
This is a premium post.
[s2If !current_user_can(access_s2member_level4)]Please register for FREE REGISTER to read full post below containing analysis. In case of any error or you think you are not able to read the full post below, please email us at support#nehcap.com [lwa][/s2If] [s2If current_user_can(access_s2member_level1)]
- EUR/USD seesaws in a small range after posting stellar rebound from multi-day low.
The pair currently trades last at 1.08646.
The previous day high was 1.093 while the previous day low was 1.0833. The daily 38.2% Fib levels comes at 1.087, expected to provide resistance. Similarly, the daily 61.8% fib level is at 1.0893, expected to provide resistance.
EUR/USD makes rounds to 1.0860-65 during the early hours of Thursday’s Asian session as bulls take a breather after posting a stellar rebound from the 2.5-month low the previous day.
The Euro pair cheered the broad risk-on mood and a slump in the US Treasury bond yields while ignoring downbeat data at home to post a notable recovery from the multi-day low. Adding strength to the major currency pair are the fresh concerns about the policy pivot at the European Central Bank (ECB) and the Federal Reserve (Fed), especially after the previous day’s downbeat Purchasing Managers Index (PMI) for August.
On Wednesday, preliminary readings of Eurozone HCOB Manufacturing PMI rose to 43.7 for August from 42.7 versus 42.6 market forecasts whereas the Services counterpart eased to 48.3, compared to 50.5 expected and 50.9 marked the previous month. With this, the HCOB Composite PMI for the bloc eased to 47.0 for the said month from 48.6 prior and versus the analysts’ estimations of 48.5.
It should be noted that the first readings of the Eurozone Consumer Confidence for August also declined to -16.0 versus -14.3 market forecasts and -15.1 previous readings.
On the other hand, the first prints of the US S&P Global Manufacturing PMI dropped to 47.0 for August from 49.0 versus 49.3 market forecasts whereas the Services counterpart also edged lower to 51.0, compared to 52.2 expected and 52.3 marked the previous month. With this, the S&P Global Composite PMI for the US eased to 50.4 for the said month from 52.0 prior and the analysts’ estimations. Further, US New Home Sales change rose to 4.4% MoM for July versus -2.5% previous readings.
Additionally, the recently upbeat headlines surrounding the US-China trade ties also underpinned the EUR/USD pair’s latest run-up.
With this, the market sentiment improved and drowned the US Treasury bond yields, as well as the US Dollar, which in turn propelled the Euro pair from the lowest level since mid-July. That said, the US Dollar Index (DXY) retreated from the 11-week high while the Wall Street benchmarks also closed in the positive territory to offer a helping hand to the buyers. More importantly, the US 10-year Treasury bond yields flashed the biggest daily fall in three weeks to portray the market’s optimism and propel the pair.
Moving on, the US Durable Goods Orders, Chicago Fed National Activity Index, Kansas Fed Manufacturing Activity and weekly Jobless Claims will decorate the calendar. However, major attention will be given to the start of the two-day-long annual Jackson Hole Symposium for clear directions.
Despite bouncing off 200-DMA support, around 1.0800 by the press time, the EUR/USD bulls need validation from the 100-DMA hurdle of 1.0930 to convince buyers.
Technical Levels: Supports and Resistances
EURUSD currently trading at 1.0865 at the time of writing. Pair opened at 1.0846 and is trading with a change of 0.18% % .
| Overview | Overview.1 | |
|---|---|---|
| 0 | Today last price | 1.0865 |
| 1 | Today Daily Change | 0.0019 |
| 2 | Today Daily Change % | 0.18% |
| 3 | Today daily open | 1.0846 |
The pair is trading below its 20 Daily moving average @ 1.095, below its 50 Daily moving average @ 1.0982 , below its 100 Daily moving average @ 1.093 and above its 200 Daily moving average @ 1.0797
| Trends | Trends.1 | |
|---|---|---|
| 0 | Daily SMA20 | 1.0950 |
| 1 | Daily SMA50 | 1.0982 |
| 2 | Daily SMA100 | 1.0930 |
| 3 | Daily SMA200 | 1.0797 |
The previous day high was 1.093 while the previous day low was 1.0833. The daily 38.2% Fib levels comes at 1.087, expected to provide resistance. Similarly, the daily 61.8% fib level is at 1.0893, expected to provide resistance.
Note the levels of interest below:
- Pivot support is noted at 1.0809, 1.0772, 1.0711
- Pivot resistance is noted at 1.0907, 1.0967, 1.1004
| Levels | Levels.1 |
|---|---|
| Previous Daily High | 1.0930 |
| Previous Daily Low | 1.0833 |
| Previous Weekly High | 1.0960 |
| Previous Weekly Low | 1.0845 |
| Previous Monthly High | 1.1276 |
| Previous Monthly Low | 1.0834 |
| Daily Fibonacci 38.2% | 1.0870 |
| Daily Fibonacci 61.8% | 1.0893 |
| Daily Pivot Point S1 | 1.0809 |
| Daily Pivot Point S2 | 1.0772 |
| Daily Pivot Point S3 | 1.0711 |
| Daily Pivot Point R1 | 1.0907 |
| Daily Pivot Point R2 | 1.0967 |
| Daily Pivot Point R3 | 1.1004 |
[/s2If]
Download Nehcap EAWe have two EAs that are operational on our LIVE accounts.
- EA-FIX: Check out the details here. Download EA-FIX . EA-FIX is a non-grid HFT scalper.
- EA-GROWTH: High quality low dd EA using trend grids. Download EA_GROWTHJoin Our Telegram Group
")


