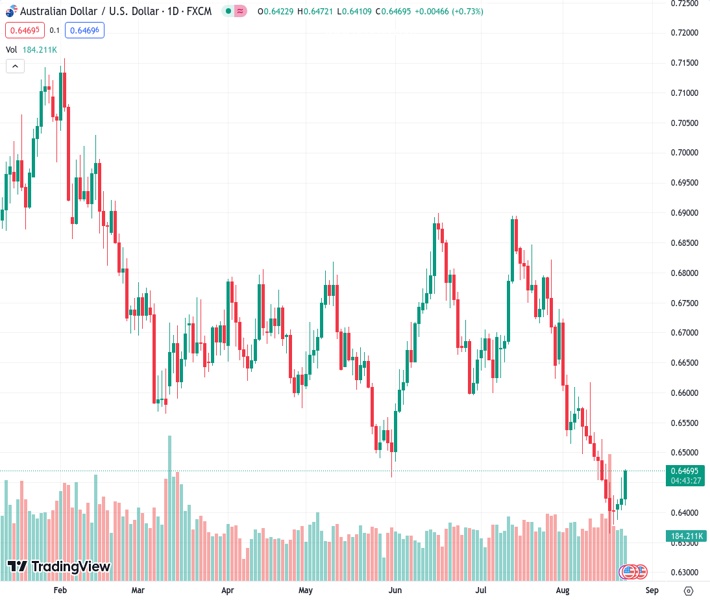
The AUDUSD currency pair has advanced for the third day in a row, increasing by over 0.60% to reach around 0.6470.
…
This is a premium post.
[s2If !current_user_can(access_s2member_level4)]Please register for FREE REGISTER to read full post below containing analysis. In case of any error or you think you are not able to read the full post below, please email us at support#nehcap.com [lwa][/s2If] [s2If current_user_can(access_s2member_level1)]
- AUD/USD sets a third consecutive day of gains, rising more than 0.60% towards 0.6470.
The pair currently trades last at 0.64674.
The previous day high was 0.6458 while the previous day low was 0.6404. The daily 38.2% Fib levels comes at 0.6437, expected to provide support. Similarly, the daily 61.8% fib level is at 0.6424, expected to provide support.
The AUD/USD gained traction in Wednesday’s session, driven by a weaker USD. The US reported lower-than-expected PMIs, but its Services sector remained resilient. At the same time, the Australian figures also failed to live up to expectations—eyes on Jerome Powell’s speech on Friday.
The US S&P Global PMIs arrived weaker than anticipated. The Manufacturing PMI fell to 47, contrasting with the projected 49.3, whereas the Services index, though below expectations, stayed within the expansion range at 51. Despite reporting soft data, the US Service sector remains resilient. At the same time, the British, German, and Australian Services index dropped below 50, and the USD may gain further traction as the US economy seems to be the last man standing.
Reacting to the weak economic activity data, the 2, 5, and 10-year US Treasury yields show sharp declines of more than 1.50%, suggesting that the markets are betting that the Federal Reserve (Fed) won’t be as aggressive as expected for the rest of the year. That being said, Jerome Powell’s speech on Friday at the Jackson Hole Symposium will be key for investors to continue modelling their expectations for the upcoming Fed meetings.
On the AUD’s side, the Manufacturing and Services PMIs from Australia from August were lower than expected at 49.4 and 46.7, respectively. China’s weakening and the contractive monetary policy from the Reserve Bank of Australia (RBA) are the main reasons for the softening of the Australian economy.
Analysing the daily chart, the technical outlook for the AUD/USD remains neutral to bullish as the bulls continue to regain their momentum. The Relative Strength Index (RSI) indicates a decrease in downward momentum with a positive slope below its midline, while the Moving Average Convergence (MACD) presents lower red bars. Additionally, the pair is below the 20,100 and 200-day Simple Moving Averages (SMAs), implying that the bears retain control on a broader scale while the buyers still have some work to do.
Support levels: 0.6440, 0.6415, 0.6400.
Resistance levels: 0.6470, 0.6490, 0.6500.
Technical Levels: Supports and Resistances
AUDUSD currently trading at 0.6468 at the time of writing. Pair opened at 0.6423 and is trading with a change of 0.7 % .
| Overview | Overview.1 | |
|---|---|---|
| 0 | Today last price | 0.6468 |
| 1 | Today Daily Change | 0.0045 |
| 2 | Today Daily Change % | 0.7000 |
| 3 | Today daily open | 0.6423 |
The pair remains strongly bearish on the daily time frame. It trades below the 20 SMA @ 0.6539, 50 SMA 0.6662, 100 SMA @ 0.6662 and 200 SMA @ 0.6731.
| Trends | Trends.1 | |
|---|---|---|
| 0 | Daily SMA20 | 0.6539 |
| 1 | Daily SMA50 | 0.6662 |
| 2 | Daily SMA100 | 0.6662 |
| 3 | Daily SMA200 | 0.6731 |
The previous day high was 0.6458 while the previous day low was 0.6404. The daily 38.2% Fib levels comes at 0.6437, expected to provide support. Similarly, the daily 61.8% fib level is at 0.6424, expected to provide support.
Note the levels of interest below:
- Pivot support is noted at 0.6398, 0.6374, 0.6344
- Pivot resistance is noted at 0.6453, 0.6482, 0.6507
| Levels | Levels.1 |
|---|---|
| Previous Daily High | 0.6458 |
| Previous Daily Low | 0.6404 |
| Previous Weekly High | 0.6522 |
| Previous Weekly Low | 0.6364 |
| Previous Monthly High | 0.6895 |
| Previous Monthly Low | 0.6599 |
| Daily Fibonacci 38.2% | 0.6437 |
| Daily Fibonacci 61.8% | 0.6424 |
| Daily Pivot Point S1 | 0.6398 |
| Daily Pivot Point S2 | 0.6374 |
| Daily Pivot Point S3 | 0.6344 |
| Daily Pivot Point R1 | 0.6453 |
| Daily Pivot Point R2 | 0.6482 |
| Daily Pivot Point R3 | 0.6507 |
[/s2If]
Download Nehcap EAWe have two EAs that are operational on our LIVE accounts.
- EA-FIX: Check out the details here. Download EA-FIX . EA-FIX is a non-grid HFT scalper.
- EA-GROWTH: High quality low dd EA using trend grids. Download EA_GROWTHJoin Our Telegram Group
")


