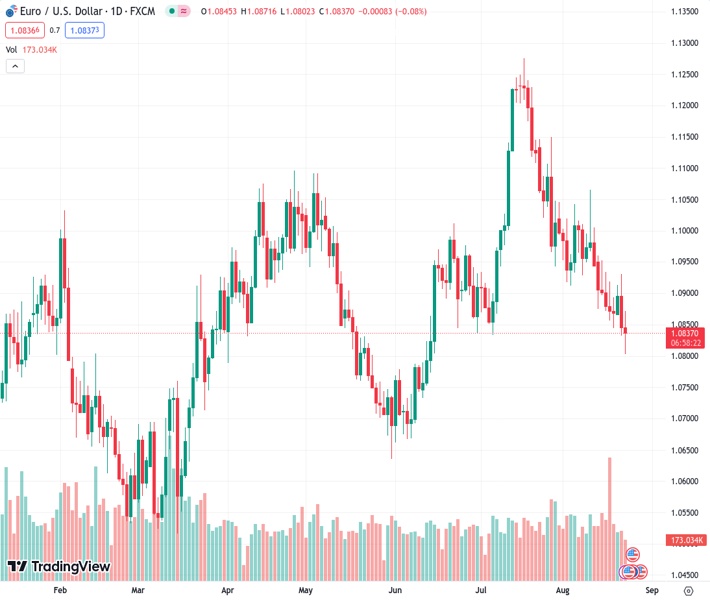
The EURUSD currency pair is experiencing additional selling force, leading to a challenge of the 1.0800 level.
…
This is a premium post.
[s2If !current_user_can(access_s2member_level4)]Please register for FREE REGISTER to read full post below containing analysis. In case of any error or you think you are not able to read the full post below, please email us at support#nehcap.com [lwa][/s2If] [s2If current_user_can(access_s2member_level1)]
- EUR/USD faces extra selling pressure and puts 1.0800 to the test.
The pair currently trades last at 1.08398.
The previous day high was 1.093 while the previous day low was 1.0833. The daily 38.2% Fib levels comes at 1.087, expected to provide resistance. Similarly, the daily 61.8% fib level is at 1.0893, expected to provide resistance.
EUR/USD extends the weekly leg lower to the boundaries of the 1.0800 region on Wednesday.
Further losses are now expected to challenge the critical 200-day SMA at 1.0797 prior to the May low of 1.0635 (May 31).
A drop below the 200-day SMA should keep extra losses in store for the time being.
Technical Levels: Supports and Resistances
EURUSD currently trading at 1.0828 at the time of writing. Pair opened at 1.0846 and is trading with a change of -0.17 % .
| Overview | Overview.1 | |
|---|---|---|
| 0 | Today last price | 1.0828 |
| 1 | Today Daily Change | 69.0000 |
| 2 | Today Daily Change % | -0.1700 |
| 3 | Today daily open | 1.0846 |
The pair is trading below its 20 Daily moving average @ 1.095, below its 50 Daily moving average @ 1.0982 , below its 100 Daily moving average @ 1.093 and above its 200 Daily moving average @ 1.0797
| Trends | Trends.1 | |
|---|---|---|
| 0 | Daily SMA20 | 1.0950 |
| 1 | Daily SMA50 | 1.0982 |
| 2 | Daily SMA100 | 1.0930 |
| 3 | Daily SMA200 | 1.0797 |
The previous day high was 1.093 while the previous day low was 1.0833. The daily 38.2% Fib levels comes at 1.087, expected to provide resistance. Similarly, the daily 61.8% fib level is at 1.0893, expected to provide resistance.
Note the levels of interest below:
- Pivot support is noted at 1.0809, 1.0772, 1.0711
- Pivot resistance is noted at 1.0907, 1.0967, 1.1004
| Levels | Levels.1 |
|---|---|
| Previous Daily High | 1.0930 |
| Previous Daily Low | 1.0833 |
| Previous Weekly High | 1.0960 |
| Previous Weekly Low | 1.0845 |
| Previous Monthly High | 1.1276 |
| Previous Monthly Low | 1.0834 |
| Daily Fibonacci 38.2% | 1.0870 |
| Daily Fibonacci 61.8% | 1.0893 |
| Daily Pivot Point S1 | 1.0809 |
| Daily Pivot Point S2 | 1.0772 |
| Daily Pivot Point S3 | 1.0711 |
| Daily Pivot Point R1 | 1.0907 |
| Daily Pivot Point R2 | 1.0967 |
| Daily Pivot Point R3 | 1.1004 |
[/s2If]
Download Nehcap EAWe have two EAs that are operational on our LIVE accounts.
- EA-FIX: Check out the details here. Download EA-FIX . EA-FIX is a non-grid HFT scalper.
- EA-GROWTH: High quality low dd EA using trend grids. Download EA_GROWTHJoin Our Telegram Group
")


