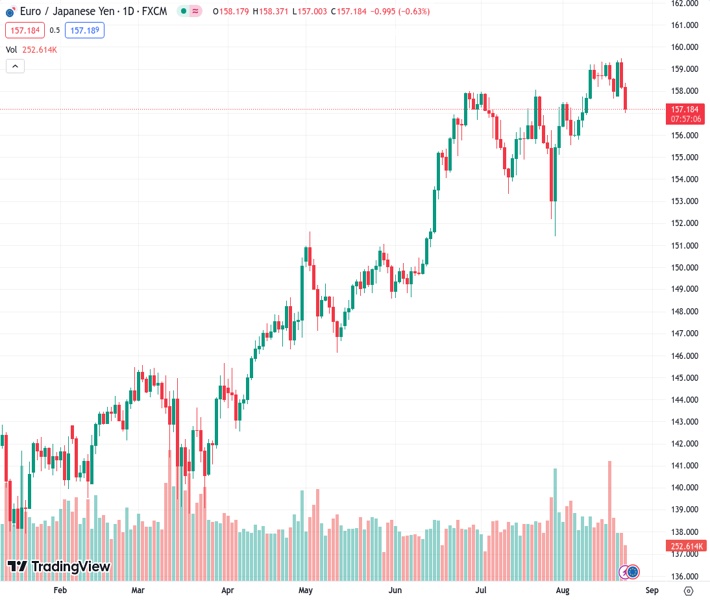
The EURJPY pair at a rate of 157.173 continues to increase its losses from Tuesday and goes back to the level of 157.00.
…
This is a premium post.
[s2If !current_user_can(access_s2member_level4)]Please register for FREE REGISTER to read full post below containing analysis. In case of any error or you think you are not able to read the full post below, please email us at support#nehcap.com [lwa][/s2If] [s2If current_user_can(access_s2member_level1)]
- EUR/JPY adds to Tuesday’s losses and revisits 157.00.
The pair currently trades last at 157.173.
The previous day high was 159.49 while the previous day low was 158.09. The daily 38.2% Fib levels comes at 158.62, expected to provide resistance. Similarly, the daily 61.8% fib level is at 158.96, expected to provide resistance.
EUR/JPY accelerates its downside momentum and drops to multi-day lows in the 157.00 neighbourhood on Wednesday.
In case the corrective retracement gathers further impulse, the cross could extend the move to the provisional 55-day SMA around 156.00, which should hold the initial test. South from here emerges the 100-day SMA near 152.50 prior to the July low of 151.40 (July 28).
So far, the longer term positive outlook for the cross appears favoured while above the 200-day SMA, today at 147.51.
Technical Levels: Supports and Resistances
EURJPY currently trading at 157.27 at the time of writing. Pair opened at 158.22 and is trading with a change of -0.6 % .
| Overview | Overview.1 | |
|---|---|---|
| 0 | Today last price | 157.27 |
| 1 | Today Daily Change | 37.00 |
| 2 | Today Daily Change % | -0.60 |
| 3 | Today daily open | 158.22 |
The pair is trading below its 20 Daily moving average @ 157.37, above its 50 Daily moving average @ 156.55 , above its 100 Daily moving average @ 152.43 and above its 200 Daily moving average @ 147.49
| Trends | Trends.1 | |
|---|---|---|
| 0 | Daily SMA20 | 157.37 |
| 1 | Daily SMA50 | 156.55 |
| 2 | Daily SMA100 | 152.43 |
| 3 | Daily SMA200 | 147.49 |
The previous day high was 159.49 while the previous day low was 158.09. The daily 38.2% Fib levels comes at 158.62, expected to provide resistance. Similarly, the daily 61.8% fib level is at 158.96, expected to provide resistance.
Note the levels of interest below:
- Pivot support is noted at 157.71, 157.2, 156.31
- Pivot resistance is noted at 159.11, 160.0, 160.52
| Levels | Levels.1 |
|---|---|
| Previous Daily High | 159.49 |
| Previous Daily Low | 158.09 |
| Previous Weekly High | 159.34 |
| Previous Weekly Low | 157.66 |
| Previous Monthly High | 158.05 |
| Previous Monthly Low | 151.41 |
| Daily Fibonacci 38.2% | 158.62 |
| Daily Fibonacci 61.8% | 158.96 |
| Daily Pivot Point S1 | 157.71 |
| Daily Pivot Point S2 | 157.20 |
| Daily Pivot Point S3 | 156.31 |
| Daily Pivot Point R1 | 159.11 |
| Daily Pivot Point R2 | 160.00 |
| Daily Pivot Point R3 | 160.52 |
[/s2If]
Download Nehcap EAWe have two EAs that are operational on our LIVE accounts.
- EA-FIX: Check out the details here. Download EA-FIX . EA-FIX is a non-grid HFT scalper.
- EA-GROWTH: High quality low dd EA using trend grids. Download EA_GROWTHJoin Our Telegram Group
")


