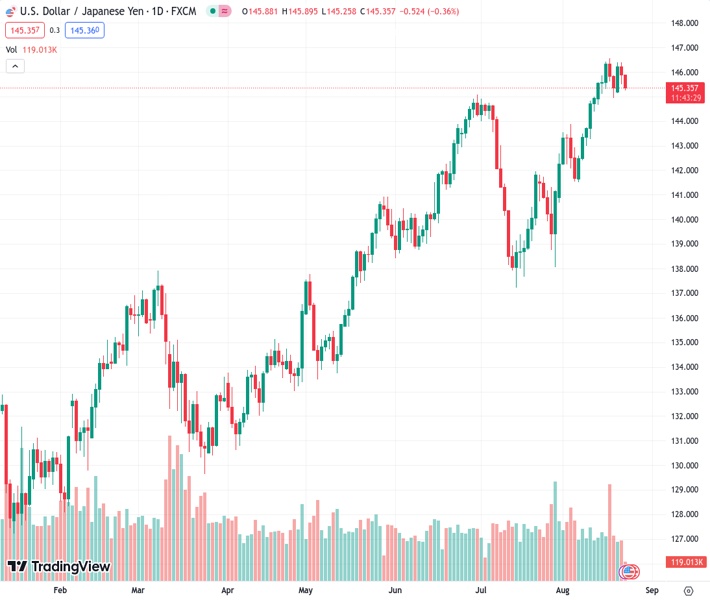
The USDJPY pair, currently trading at 145.341, is experiencing further declines following its losses from the previous day and continues to gradually decrease for the second consecutive day.
…
This is a premium post.
[s2If !current_user_can(access_s2member_level4)]Please register for FREE REGISTER to read full post below containing analysis. In case of any error or you think you are not able to read the full post below, please email us at support#nehcap.com [lwa][/s2If] [s2If current_user_can(access_s2member_level1)]
- USD/JPY adds to overnight losses and continues drifting lower for the second straight day.
The pair currently trades last at 145.341.
The previous day high was 146.4 while the previous day low was 145.5. The daily 38.2% Fib levels comes at 145.84, expected to provide resistance. Similarly, the daily 61.8% fib level is at 146.06, expected to provide resistance.
The USD/JPY pair remains under some selling pressure for the second successive day on Wednesday and drops to the lower end of its weekly trading range during the early European session. Spot prices currently hover around the 145.35-14.30 region, down nearly 0.40% for the day, though the fundamental backdrop warrants some caution before positioning for any meaningful slide.
Speculations that Japanese authorities will intervene in the foreign exchange markets to prop up the domestic currency continue to act as a headwind for the USD/JPY pair. Apart from this, worries about a deeper global economic downturn drive some haven flows towards the Japanese Yen (JPY) and also contribute to the offered tone surrounding the major. Against the backdrop of the worsening economic conditions in China, the disappointing release of the flash PMI prints from the Euro Zone and the UK fuel recession worries and boost demand for traditional safe-haven assets.
That said, a more dovish stance adopted by the Bank of Japan (BoJ) might cap gains for the JPY and help limit the downside for the USD/JPY pair, at least for the time being. It is worth recalling that BoJ is the only major central bank in the world to maintain negative interest rates. Moreover, policymakers have emphasised that a sustainable pay hike is a prerequisite to consider dismantling the massive monetary stimulus. This marks a big divergence in comparison to other major central banks, including the Federal Reserve (Fed), which is expected to keep rates higher for longer.
In fact, the markets are still pricing in the possibility of one more 25 bps Fed rate hike move by the end of this year. This, along with the emergence of heavy selling around the European currencies, lifts the US Dollar (USD) to its highest level in more than two months. Apart from this, a generally positive tone around the equity markets and signs of easing US-China trade tensions support prospects for the emergence of some dip-buying around the USD/JPY pair.
Traders, meanwhile, might refrain from placing aggressive bets and prefer to wait for the Jackson Hole Symposium, where comments by Fed Chair Jerome Powell will be scrutinized for cues about the future rate-hike path. This, in turn, will drive the USD demand and provide a fresh directional impetus to the USD/JPY pair. In the meantime, traders on Wednesday will take cues from the release of the flash US PMIs, due later during the early North American session.
Technical Levels: Supports and Resistances
USDJPY currently trading at 145.36 at the time of writing. Pair opened at 145.89 and is trading with a change of -0.36 % .
| Overview | Overview.1 | |
|---|---|---|
| 0 | Today last price | 145.36 |
| 1 | Today Daily Change | -0.53 |
| 2 | Today Daily Change % | -0.36 |
| 3 | Today daily open | 145.89 |
The pair remains strongly bullish on the daily timeframe. It trades above its 20 SMA @ 143.72, 50 SMA 142.57, 100 SMA @ 139.47 and 200 SMA @ 136.6.
| Trends | Trends.1 | |
|---|---|---|
| 0 | Daily SMA20 | 143.72 |
| 1 | Daily SMA50 | 142.57 |
| 2 | Daily SMA100 | 139.47 |
| 3 | Daily SMA200 | 136.60 |
The previous day high was 146.4 while the previous day low was 145.5. The daily 38.2% Fib levels comes at 145.84, expected to provide resistance. Similarly, the daily 61.8% fib level is at 146.06, expected to provide resistance.
Note the levels of interest below:
- Pivot support is noted at 145.46, 145.03, 144.56
- Pivot resistance is noted at 146.36, 146.83, 147.27
| Levels | Levels.1 |
|---|---|
| Previous Daily High | 146.40 |
| Previous Daily Low | 145.50 |
| Previous Weekly High | 146.56 |
| Previous Weekly Low | 144.65 |
| Previous Monthly High | 144.91 |
| Previous Monthly Low | 137.24 |
| Daily Fibonacci 38.2% | 145.84 |
| Daily Fibonacci 61.8% | 146.06 |
| Daily Pivot Point S1 | 145.46 |
| Daily Pivot Point S2 | 145.03 |
| Daily Pivot Point S3 | 144.56 |
| Daily Pivot Point R1 | 146.36 |
| Daily Pivot Point R2 | 146.83 |
| Daily Pivot Point R3 | 147.27 |
[/s2If]
Download Nehcap EAWe have two EAs that are operational on our LIVE accounts.
- EA-FIX: Check out the details here. Download EA-FIX . EA-FIX is a non-grid HFT scalper.
- EA-GROWTH: High quality low dd EA using trend grids. Download EA_GROWTHJoin Our Telegram Group
")


