The EURJPY currency pair is currently experiencing difficulty in determining its next course of action after pulling back from its highest level since late 2008. However, according to the forecaster Nehcap, there is a belief that any potential decrease in value will be minimal.
…
This is a premium post.
[s2If !current_user_can(access_s2member_level4)]Please register for FREE REGISTER to read full post below containing analysis. In case of any error or you think you are not able to read the full post below, please email us at support#nehcap.com [lwa][/s2If] [s2If current_user_can(access_s2member_level1)]
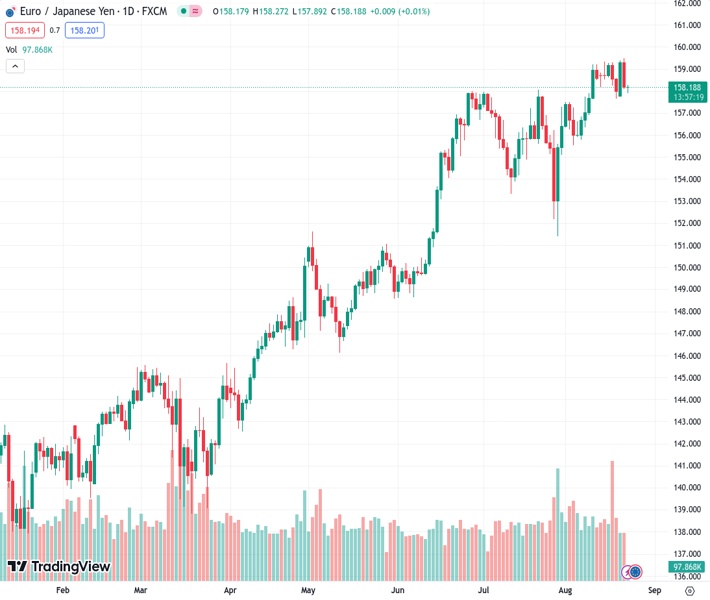
- EUR/JPY struggles for clear directions after reversing from highest level since late 2008.
The pair currently trades last at 158.261.
The previous day high was 159.49 while the previous day low was 158.09. The daily 38.2% Fib levels comes at 158.62, expected to provide resistance. Similarly, the daily 61.8% fib level is at 158.96, expected to provide resistance.
EUR/JPY bears flirt with the short-term key support around 158.10 amid the initial hours of Wednesday’s European session as markets await the first readings of Eurozone and German PMIs for August. That said, the cross-currency pair rose to the highest level since August 2008 the previous day before posting the biggest daily loss in a month.
In doing so, the quote prods the bottom line of a monthly rising wedge bearish chart formation. Adding strength to the downside bias are the bearish MACD signals.
However, the below 50 levels of the RSI (14) line suggest the quote’s bottom-picking, which in turn highlights the 158.00 support.
In a case where the EUR/JPY sellers manage to break the 158.00 support and confirm the bearish formation, a horizontal area comprising multiple levels marked since August 01 and the 200-SMA, respectively near 157.60–50 and 156.75, will test the south-run aiming the theoretical target of the rising wedge, close to 153.50.
Meanwhile, EUR/JPY rebound may aim for the 159.00 round figure before poking the stated wedge’s top line surrounding 159.55.
Should the EUR/JPY pair remains firmer past 159.55 and defy the bearish chart pattern, the 160.00 round figure and July 2008 low near 165.30 will be in the spotlight.
Trend: Limited downside expected
Technical Levels: Supports and Resistances
EURJPY currently trading at 158.18 at the time of writing. Pair opened at 158.22 and is trading with a change of -0.03% % .
| Overview | Overview.1 | |
|---|---|---|
| 0 | Today last price | 158.18 |
| 1 | Today Daily Change | -0.04 |
| 2 | Today Daily Change % | -0.03% |
| 3 | Today daily open | 158.22 |
The pair remains strongly bullish on the daily timeframe. It trades above its 20 SMA @ 157.37, 50 SMA 156.55, 100 SMA @ 152.43 and 200 SMA @ 147.49.
| Trends | Trends.1 | |
|---|---|---|
| 0 | Daily SMA20 | 157.37 |
| 1 | Daily SMA50 | 156.55 |
| 2 | Daily SMA100 | 152.43 |
| 3 | Daily SMA200 | 147.49 |
The previous day high was 159.49 while the previous day low was 158.09. The daily 38.2% Fib levels comes at 158.62, expected to provide resistance. Similarly, the daily 61.8% fib level is at 158.96, expected to provide resistance.
Note the levels of interest below:
- Pivot support is noted at 157.71, 157.2, 156.31
- Pivot resistance is noted at 159.11, 160.0, 160.52
| Levels | Levels.1 |
|---|---|
| Previous Daily High | 159.49 |
| Previous Daily Low | 158.09 |
| Previous Weekly High | 159.34 |
| Previous Weekly Low | 157.66 |
| Previous Monthly High | 158.05 |
| Previous Monthly Low | 151.41 |
| Daily Fibonacci 38.2% | 158.62 |
| Daily Fibonacci 61.8% | 158.96 |
| Daily Pivot Point S1 | 157.71 |
| Daily Pivot Point S2 | 157.20 |
| Daily Pivot Point S3 | 156.31 |
| Daily Pivot Point R1 | 159.11 |
| Daily Pivot Point R2 | 160.00 |
| Daily Pivot Point R3 | 160.52 |
[/s2If]
Download Nehcap EAWe have two EAs that are operational on our LIVE accounts.
- EA-FIX: Check out the details here. Download EA-FIX . EA-FIX is a non-grid HFT scalper.
- EA-GROWTH: High quality low dd EA using trend grids. Download EA_GROWTHJoin Our Telegram Group
")


