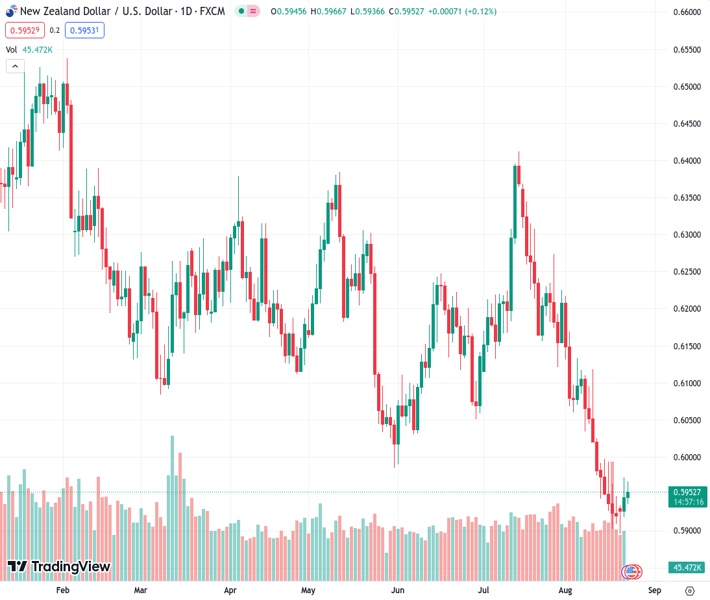
The NZDUSD currency pair has surpassed the 10-day moving average hurdle at a rate of 0.59548, despite the relative strength index (RSI) indicating the market is close to being oversold. The market has chosen to overlook the mixed details regarding New Zealand’s retail sales. According to the viewpoint of Nehcap, a limited recovery is anticipated.
…
This is a premium post.
[s2If !current_user_can(access_s2member_level4)]Please register for FREE REGISTER to read full post below containing analysis. In case of any error or you think you are not able to read the full post below, please email us at support#nehcap.com [lwa][/s2If] [s2If current_user_can(access_s2member_level1)]
- NZD/USD pierces 10-DMA hurdle amid nearly oversold RSI, ignores mixed NZ Retail Sales details.
The pair currently trades last at 0.59548.
The previous day high was 0.5973 while the previous day low was 0.5918. The daily 38.2% Fib levels comes at 0.5952, expected to provide support. Similarly, the daily 61.8% fib level is at 0.5939, expected to provide support.
NZD/USD struggles to defend the previous day’s run-up as it prods the 100-DMA resistance amid early Wednesday morning in Europe. In doing so, the Kiwi pair justifies the market’s dilemma amid mixed New Zealand Retail Sales data and the US Dollar’s retreat ahead of the key US PMIs for August. That said, the quote seesaws around 0.5950 by the press time.
As per Statistics New Zealand, the Pacific major’s Retail Sales improved during the second quarter (Q2) of 2023. On the same line could be the comments from Reserve Bank of New Zealand (RBNZ) Chief Economist Paul Conway. However, the Retail Sales ex Autos, also known as the Core Retail Sales, marked downbeat print and challenges the national growth concerns, as well as the Kiwi pair buyers.
On the contrary, the US Dollar Index (DXY) retreats from the 10-week high marked the previous day to around 103.50 at the latest.
Technically, the nearly oversold RSI (14) line allows the NZD/USD traders to pare recent losses while bouncing off the yearly low.
Though, a convergence of May’s low and the top line of a five-week-long falling wedge bullish chart formation, around 0.5980-85, appears a tough nut to crack for the Kiwi pair buyers.
On the flip side, the Year-To-Date (YTD) low marked on Monday around 0.5895 restricts the short-term downside of the NZD/USD pair.
Following that, the aforementioned wedge’s bottom line, close to 0.5850, will be in the spotlight.
To sum up, NZD/USD stays in recovery mode but the pair’s further upside appears difficult unless gaining strong fundamental support.
Trend: Limited recovery expected
Technical Levels: Supports and Resistances
NZDUSD currently trading at 0.595 at the time of writing. Pair opened at 0.5946 and is trading with a change of 0.07% % .
| Overview | Overview.1 | |
|---|---|---|
| 0 | Today last price | 0.595 |
| 1 | Today Daily Change | 0.0004 |
| 2 | Today Daily Change % | 0.07% |
| 3 | Today daily open | 0.5946 |
The pair remains strongly bearish on the daily time frame. It trades below the 20 SMA @ 0.6048, 50 SMA 0.6142, 100 SMA @ 0.6162 and 200 SMA @ 0.623.
| Trends | Trends.1 | |
|---|---|---|
| 0 | Daily SMA20 | 0.6048 |
| 1 | Daily SMA50 | 0.6142 |
| 2 | Daily SMA100 | 0.6162 |
| 3 | Daily SMA200 | 0.6230 |
The previous day high was 0.5973 while the previous day low was 0.5918. The daily 38.2% Fib levels comes at 0.5952, expected to provide support. Similarly, the daily 61.8% fib level is at 0.5939, expected to provide support.
Note the levels of interest below:
- Pivot support is noted at 0.5918, 0.5891, 0.5863
- Pivot resistance is noted at 0.5973, 0.6001, 0.6028
| Levels | Levels.1 |
|---|---|
| Previous Daily High | 0.5973 |
| Previous Daily Low | 0.5918 |
| Previous Weekly High | 0.5997 |
| Previous Weekly Low | 0.5903 |
| Previous Monthly High | 0.6413 |
| Previous Monthly Low | 0.6120 |
| Daily Fibonacci 38.2% | 0.5952 |
| Daily Fibonacci 61.8% | 0.5939 |
| Daily Pivot Point S1 | 0.5918 |
| Daily Pivot Point S2 | 0.5891 |
| Daily Pivot Point S3 | 0.5863 |
| Daily Pivot Point R1 | 0.5973 |
| Daily Pivot Point R2 | 0.6001 |
| Daily Pivot Point R3 | 0.6028 |
[/s2If]
Download Nehcap EAWe have two EAs that are operational on our LIVE accounts.
- EA-FIX: Check out the details here. Download EA-FIX . EA-FIX is a non-grid HFT scalper.
- EA-GROWTH: High quality low dd EA using trend grids. Download EA_GROWTHJoin Our Telegram Group
")


