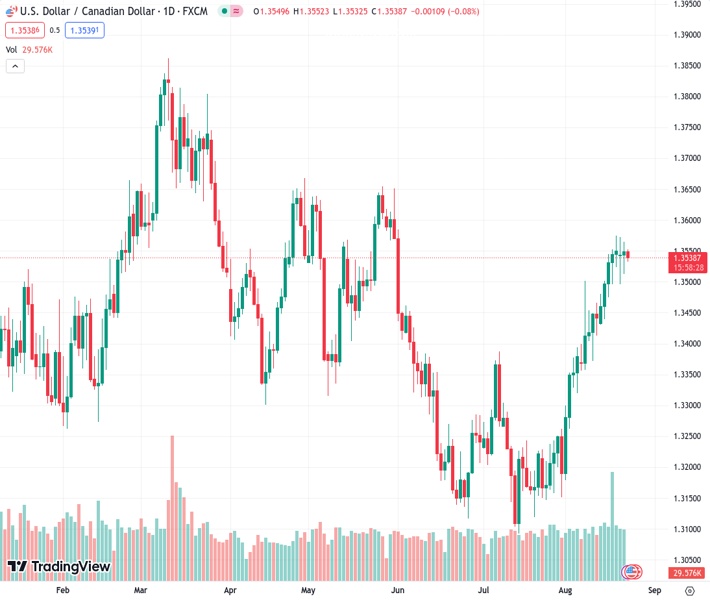
The USDCAD exchange rate decreases slightly to 1.35384 as investors gear up for significant data releases, with a slightly optimistic sentiment in the markets.
…
This is a premium post.
[s2If !current_user_can(access_s2member_level4)]Please register for FREE REGISTER to read full post below containing analysis. In case of any error or you think you are not able to read the full post below, please email us at support#nehcap.com [lwa][/s2If] [s2If current_user_can(access_s2member_level1)]
- USD/CAD edges lower as markets prepare for top-tier data with slightly positive mood.
The pair currently trades last at 1.35384.
The previous day high was 1.3565 while the previous day low was 1.3513. The daily 38.2% Fib levels comes at 1.3545, expected to provide resistance. Similarly, the daily 61.8% fib level is at 1.3533, expected to provide support.
USD/CAD holds lower grounds near 1.3540 while portraying a sluggish weekly move heading into Wednesday’s European session.
The Loonie pair clings to mild losses amid a softer US Dollar and the recent improvement in Canada’s key export item WTI crude oil as markets await top-tier data from the US and Canada.
That said, the US Dollar Index (DXY) retreats from the 10-week high marked the previous day to around 103.50 at the latest while the WTI crude oil snaps a two-day losing streak by rising 0.20% intraday to $79.75 by the press time.
It’s worth noting that the market’s cautious optimism joins a pullback in the US Treasury bond yields to prod the Greenback buyers, as well as underpin the Oil price rebound.
Among the major catalysts contributing to the slightly positive mood are the headlines suggesting a likely improvement in the US–China ties, due to US Commerce Secretary Gina Raimondo’s visit to Beijing, scheduled for next week. On the same line are the early-week news suggesting the US removal of 27 Chinese entities from its Unverified List, lifting sanctions from those entities and flagging hopes of improving diplomatic ties.
Furthermore, mixed US data and Fed talks also prod the DXY bulls as market participants don’t expect the hawkish appearance of Fed Chair Jerome Powell at this week’s annual Jackson Hole event. That said, the US flashed slight improvement in the US Existing Home Sales for July and the Richmond Fed Manufacturing Index for August, which in turn should entertain the USD/JPY sellers. However, hawkish statements from Federal Reserve Bank of Richmond President Thomas Barkin put a floor under the pair.
Against this backdrop, the US 10-year Treasury bond yields keep the previous day’s retreat from the highest level since late 2007 to 4.31% whereas S&P500 Futures rise 0.25% intraday to regain 4,410 level after reversing from a one-week high the previous day.
Looking ahead, Canadian Retail Sales for June, expected to ease on MoM but likely flashing improving the positive Core details, may direct intraday traders of the USD/CAD pair ahead of the preliminary readings of the August month Purchasing Managers Indexes (PMIs) and Existing Home Sales for July for the US.
Multiple pin bar candlesticks on the daily chart suggest the bullish exhaustion of the USD/CAD pair. However, the 10-DMA level of around 1.3510, quickly followed by the 1.3500 round figure, act as additional checks for the Loonie pair sellers before taking control.
Technical Levels: Supports and Resistances
USDCAD currently trading at 1.354 at the time of writing. Pair opened at 1.355 and is trading with a change of -0.07% % .
| Overview | Overview.1 | |
|---|---|---|
| 0 | Today last price | 1.354 |
| 1 | Today Daily Change | -0.0010 |
| 2 | Today Daily Change % | -0.07% |
| 3 | Today daily open | 1.355 |
The pair remains strongly bullish on the daily timeframe. It trades above its 20 SMA @ 1.3401, 50 SMA 1.329, 100 SMA @ 1.3387 and 200 SMA @ 1.3456.
| Trends | Trends.1 | |
|---|---|---|
| 0 | Daily SMA20 | 1.3401 |
| 1 | Daily SMA50 | 1.3290 |
| 2 | Daily SMA100 | 1.3387 |
| 3 | Daily SMA200 | 1.3456 |
The previous day high was 1.3565 while the previous day low was 1.3513. The daily 38.2% Fib levels comes at 1.3545, expected to provide resistance. Similarly, the daily 61.8% fib level is at 1.3533, expected to provide support.
Note the levels of interest below:
- Pivot support is noted at 1.352, 1.3491, 1.3468
- Pivot resistance is noted at 1.3573, 1.3595, 1.3625
| Levels | Levels.1 |
|---|---|
| Previous Daily High | 1.3565 |
| Previous Daily Low | 1.3513 |
| Previous Weekly High | 1.3575 |
| Previous Weekly Low | 1.3437 |
| Previous Monthly High | 1.3387 |
| Previous Monthly Low | 1.3093 |
| Daily Fibonacci 38.2% | 1.3545 |
| Daily Fibonacci 61.8% | 1.3533 |
| Daily Pivot Point S1 | 1.3520 |
| Daily Pivot Point S2 | 1.3491 |
| Daily Pivot Point S3 | 1.3468 |
| Daily Pivot Point R1 | 1.3573 |
| Daily Pivot Point R2 | 1.3595 |
| Daily Pivot Point R3 | 1.3625 |
[/s2If]
Download Nehcap EAWe have two EAs that are operational on our LIVE accounts.
- EA-FIX: Check out the details here. Download EA-FIX . EA-FIX is a non-grid HFT scalper.
- EA-GROWTH: High quality low dd EA using trend grids. Download EA_GROWTHJoin Our Telegram Group
")


