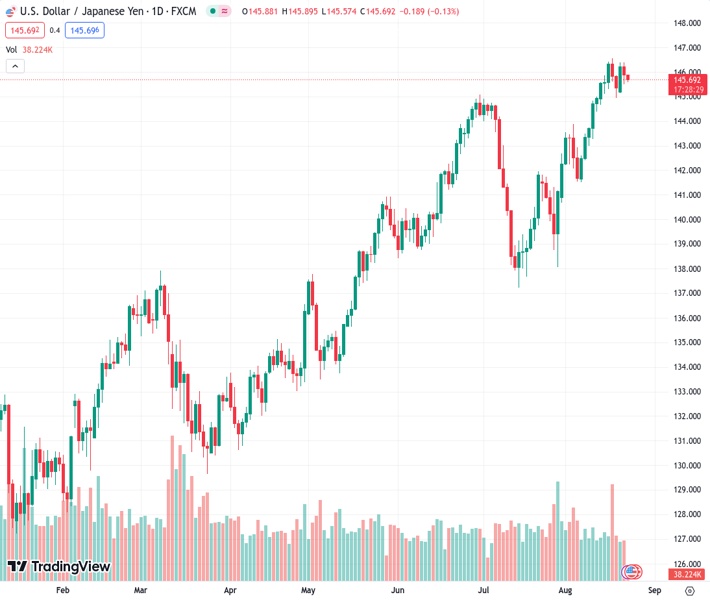
The USDJPY currency pair is staying at a low point of 145.697 and continues to be in a negative state for the second day in a row.
…
This is a premium post.
[s2If !current_user_can(access_s2member_level4)]Please register for FREE REGISTER to read full post below containing analysis. In case of any error or you think you are not able to read the full post below, please email us at support#nehcap.com [lwa][/s2If] [s2If current_user_can(access_s2member_level1)]
- USD/JPY remains depressed at intraday low, down for the second consecutive day.
The pair currently trades last at 145.697.
The previous day high was 146.4 while the previous day low was 145.5. The daily 38.2% Fib levels comes at 145.84, expected to provide resistance. Similarly, the daily 61.8% fib level is at 146.06, expected to provide resistance.
USD/JPY holds lower grounds near the intraday bottom, sidelined around 146.60-70 during early Wednesday morning in Europe, as market players seek more clues to extend the Yen pair’s two-day downtrend. Even so, upbeat Japan data and a pullback in the Treasury bond yields join cautious optimism to weigh on the risk-barometer pair ahead of the top-tier US activity data for August.
Earlier in the day, Japan’s first reading of the Jibun Bank Manufacturing PMI for August improves to 49.7 from 49.6, versus 49.5 expected, whereas the Services counterpart rose to 54.3 for the said month from 53.8 previous figures.
Talking about the bond coupons, the US 10-year Treasury bond yields keep the previous day’s retreat from the highest level since late 2007 to 4.31% by the press time whereas the yields of Japanese Government Bonds (JGBs) struggle around the levels last seen in 2014.
Also exerting downside pressure on the Yen pair could be the mixed concerns about the Bank of Japan (BoJ) as Governor Kazuo Ueda refrained from discussing the details of Tuesday’s meeting with Japan Prime Minister Fumio Kishida, which he termed a ‘routine’ one. BoJ’s Kuroda, however, did mention that he explained BoJ’s July policy decision to the PM.
On the other hand, the US flashed slight improvement in the US Existing Home Sales for July and the Richmond Fed Manufacturing Index for August, which in turn should entertain the USD/JPY sellers. However, hawkish statements from Federal Reserve Bank of Richmond President Thomas Barkin put a floor under the pair.
Additionally, hopes of witnessing improvement in the US-China ties and upbeat performance of Japan’s benchmark equity gauge Nikkei seem to defend the risk takers and weigh on the USD/JPY pair amid uncertainty about the major central bank’s next moves.
Looking forward, the preliminary readings of the August month Purchasing Managers Indexes (PMIs) and Existing Home Sales for July for the US will join the US-China headlines, as well as the bond market moves, to direct intraday moves of the USD/JPY pair. However, major attention will be given to Friday’s Tokyo Consumer Price Index for August and top-tier central bankers’ speeches at the annual Jackson Hole Symposium event for clear directions.
Although multiple tops around 146.50-60 join the nearly overbought RSI (14) line to challenge the USD/JPY buyers, the Yen pair’s downside remains elusive unless providing a daily close beneath 144.80-70 support zone comprising levels marked during late June and early July.
Technical Levels: Supports and Resistances
USDJPY currently trading at 145.68 at the time of writing. Pair opened at 145.89 and is trading with a change of -0.14% % .
| Overview | Overview.1 | |
|---|---|---|
| 0 | Today last price | 145.68 |
| 1 | Today Daily Change | -0.21 |
| 2 | Today Daily Change % | -0.14% |
| 3 | Today daily open | 145.89 |
The pair remains strongly bullish on the daily timeframe. It trades above its 20 SMA @ 143.72, 50 SMA 142.57, 100 SMA @ 139.47 and 200 SMA @ 136.6.
| Trends | Trends.1 | |
|---|---|---|
| 0 | Daily SMA20 | 143.72 |
| 1 | Daily SMA50 | 142.57 |
| 2 | Daily SMA100 | 139.47 |
| 3 | Daily SMA200 | 136.60 |
The previous day high was 146.4 while the previous day low was 145.5. The daily 38.2% Fib levels comes at 145.84, expected to provide resistance. Similarly, the daily 61.8% fib level is at 146.06, expected to provide resistance.
Note the levels of interest below:
- Pivot support is noted at 145.46, 145.03, 144.56
- Pivot resistance is noted at 146.36, 146.83, 147.27
| Levels | Levels.1 |
|---|---|
| Previous Daily High | 146.40 |
| Previous Daily Low | 145.50 |
| Previous Weekly High | 146.56 |
| Previous Weekly Low | 144.65 |
| Previous Monthly High | 144.91 |
| Previous Monthly Low | 137.24 |
| Daily Fibonacci 38.2% | 145.84 |
| Daily Fibonacci 61.8% | 146.06 |
| Daily Pivot Point S1 | 145.46 |
| Daily Pivot Point S2 | 145.03 |
| Daily Pivot Point S3 | 144.56 |
| Daily Pivot Point R1 | 146.36 |
| Daily Pivot Point R2 | 146.83 |
| Daily Pivot Point R3 | 147.27 |
[/s2If]
Download Nehcap EAWe have two EAs that are operational on our LIVE accounts.
- EA-FIX: Check out the details here. Download EA-FIX . EA-FIX is a non-grid HFT scalper.
- EA-GROWTH: High quality low dd EA using trend grids. Download EA_GROWTHJoin Our Telegram Group
")


