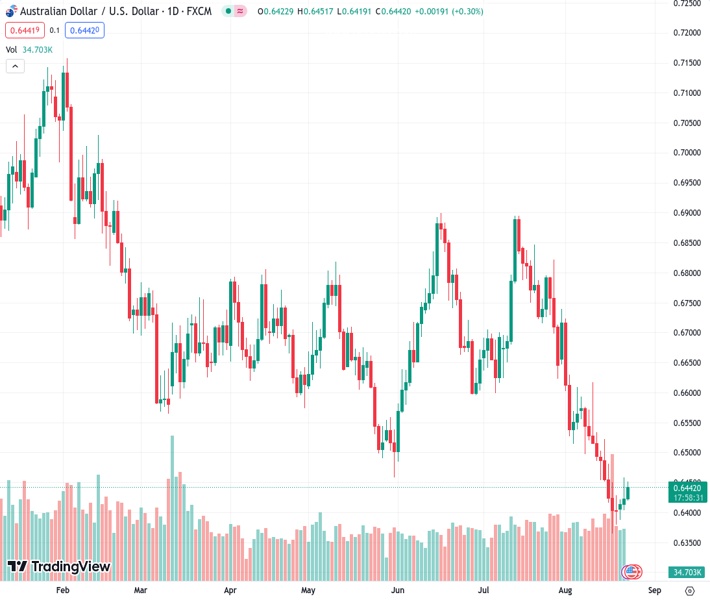
The AUDUSD pair, currently at 0.64419, is experiencing further upward momentum and benefiting from a weaker US dollar.
…
This is a premium post.
[s2If !current_user_can(access_s2member_level4)]Please register for FREE REGISTER to read full post below containing analysis. In case of any error or you think you are not able to read the full post below, please email us at support#nehcap.com [lwa][/s2If] [s2If current_user_can(access_s2member_level1)]
- AUD/USD gains some follow-through positive traction and draws support from a softer USD.
The pair currently trades last at 0.64419.
The previous day high was 0.6458 while the previous day low was 0.6404. The daily 38.2% Fib levels comes at 0.6437, expected to provide support. Similarly, the daily 61.8% fib level is at 0.6424, expected to provide support.
The AUD/USD pair attracts some dip-buying following the overnight pullback from a multi-day peak and sticks to its gains through the Asian session on Wednesday. Spot prices currently trade around mid-0.6400s, up just over 0.40% for the day, and look to build on the recent recovery from the lowest level since November 2022 touched last Thursday amid a mildly softer tone surrounding the US Dollar (USD).
In fact, the USD Index (DXY), which tracks the Greenback against a basket of currencies, erodes a part of the previous day’s gains to a more than two-month high and is pressured by retreating US Treasury bond yields. Apart from this, a generally positive tone around the US equity futures prompts some profit-taking around the safe-haven buck and benefits the risk-sensitive Australian Dollar (AUD). Against the backdrop of hopes for more stimulus from China, signs of easing US-China trade tensions lead to a slight improvement in the global risk sentiment.
It is worth recalling that the US Commerce Department’s Bureau of Industry and Security (BIS) announced on Monday that it will remove 27 Chinese entities from its Unverified List. China welcomed the move and said that it is conducive to normal trade between the two nations. This comes ahead of US Secretary of Commerce Gina Raimondo’s visit to China on August 27-30, for meetings with senior Chinese officials and US business leaders. That said, concerns over a Chinese economic slowdown keep a lid on the optimism and the China-proxy Aussie.
A smaller rate cut by the People’s Bank of China (PBoC) signalled limited policy support for the economy, despite a deepening crisis in the domestic property sector, and did little to ease worries about the worsening economic conditions. This, along with weaker Australian PMI prints, might hold back traders from placing aggressive bullish bets around the AUD/USD pair. The latest survey from Judo Bank revealed that the manufacturing sector in Australia continued to contract in August and services activity shrank at the fastest pace in 19 months.
Furthermore, growing acceptance that the Federal Reserve (Fed) will stick to its hawkish stance and keep interest rates higher for longer favours the USD bulls, which might further contribute to capping the AUD/USD pair. Market participants now look to the release of the flash US PMIs for a fresh impetus later during the early North American session. The focus, however, will remain on the Jackson Hole Symposium, where comments by Fed Chair Jerome Powell might provide cues about the future rate hike path and drive the USD demand in the near term.
Technical Levels: Supports and Resistances
AUDUSD currently trading at 0.6447 at the time of writing. Pair opened at 0.6423 and is trading with a change of 0.37 % .
| Overview | Overview.1 | |
|---|---|---|
| 0 | Today last price | 0.6447 |
| 1 | Today Daily Change | 0.0024 |
| 2 | Today Daily Change % | 0.3700 |
| 3 | Today daily open | 0.6423 |
The pair remains strongly bearish on the daily time frame. It trades below the 20 SMA @ 0.6539, 50 SMA 0.6662, 100 SMA @ 0.6662 and 200 SMA @ 0.6731.
| Trends | Trends.1 | |
|---|---|---|
| 0 | Daily SMA20 | 0.6539 |
| 1 | Daily SMA50 | 0.6662 |
| 2 | Daily SMA100 | 0.6662 |
| 3 | Daily SMA200 | 0.6731 |
The previous day high was 0.6458 while the previous day low was 0.6404. The daily 38.2% Fib levels comes at 0.6437, expected to provide support. Similarly, the daily 61.8% fib level is at 0.6424, expected to provide support.
Note the levels of interest below:
- Pivot support is noted at 0.6398, 0.6374, 0.6344
- Pivot resistance is noted at 0.6453, 0.6482, 0.6507
| Levels | Levels.1 |
|---|---|
| Previous Daily High | 0.6458 |
| Previous Daily Low | 0.6404 |
| Previous Weekly High | 0.6522 |
| Previous Weekly Low | 0.6364 |
| Previous Monthly High | 0.6895 |
| Previous Monthly Low | 0.6599 |
| Daily Fibonacci 38.2% | 0.6437 |
| Daily Fibonacci 61.8% | 0.6424 |
| Daily Pivot Point S1 | 0.6398 |
| Daily Pivot Point S2 | 0.6374 |
| Daily Pivot Point S3 | 0.6344 |
| Daily Pivot Point R1 | 0.6453 |
| Daily Pivot Point R2 | 0.6482 |
| Daily Pivot Point R3 | 0.6507 |
[/s2If]
Download Nehcap EAWe have two EAs that are operational on our LIVE accounts.
- EA-FIX: Check out the details here. Download EA-FIX . EA-FIX is a non-grid HFT scalper.
- EA-GROWTH: High quality low dd EA using trend grids. Download EA_GROWTHJoin Our Telegram Group
")


